Free Shipping logo FREE SHIPPING £75+
50 years of Telonic Instruments Ltd logo CELEBRATING 50+ YEARS
Price Match logo PRICE MATCH GUARANTEE

Programming Example: Open Socket LAN connection using Python

Posted on: December 14th, 2020 by Doug Lovell

Automating a test can dramatically increase the productivity, throughput, and accuracy of a process. Automating a setup involves connecting a computer to the test instrumentation using a standard communications bus like USB or LAN and then utilizing code entered via a software layer (like LabVIEW, .NET, Python, etc..) to sequence the specific instrument commands and process data.

In this note, we are going to show how to use Python to create a communications link between an instrument and a remote computer using a LAN connection. Once the connection is verified, you can begin to work on the control software.

NOTE: This example requires open sockets on the instrumentation. At this time, not all SIGLENT products feature open sockets. Check the product page FAQs or with your local SIGLENT support office for more information.

Python is an interpreted programming language that lets you work quickly and is very portable. Python has a low-level networking module that provides access to the socket interface. Python scripts can be written for sockets to do a variety of test and measurements tasks.

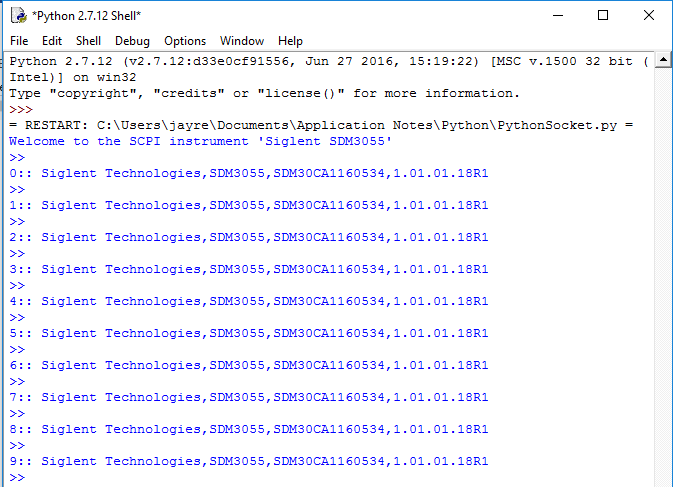
Here is a Python 2.7 script that opens a socket, sends a query and closes the socket. It performs this operation in a loop 10 times:

PythonSocket_052018

You can follow the instructions below to build your own example:


1. Power on and connect the instrument to the network via LAN

2. Verify that the Gateway, Subnet Mask, and IP address of the instrument are valid for the network you wish to use. This information is typically located in the System Information or IO menu. See the specific instrument user’s guide for more information on LAN settings.

3. Download python and your favorite python editor (I use IDLE):

https://www.python.org/

https://docs.python.org/2/library/idle.html

Start your python editor:

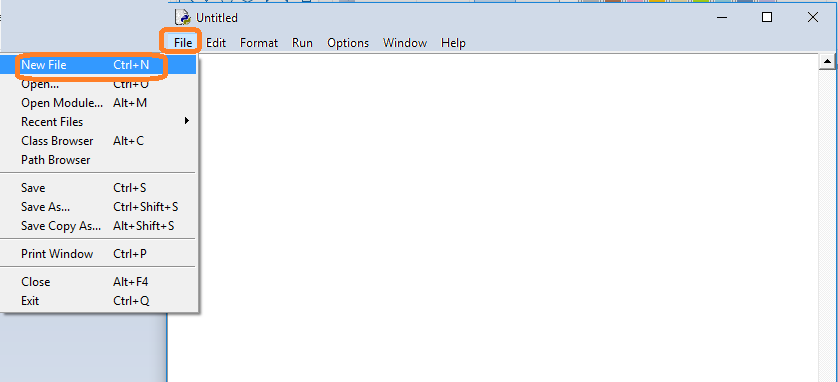
5. Open a new file by pressing File > New File.. and name the file

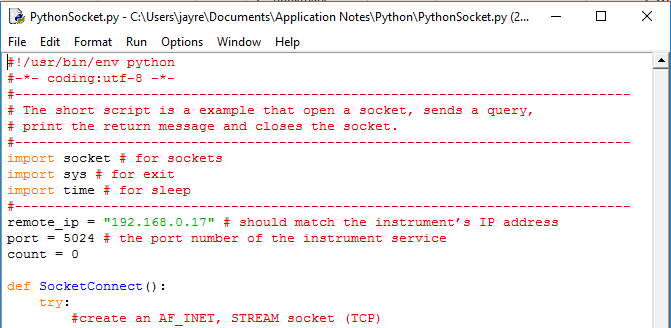
6. Copy and paste the code at the end of this note into the file editing window:

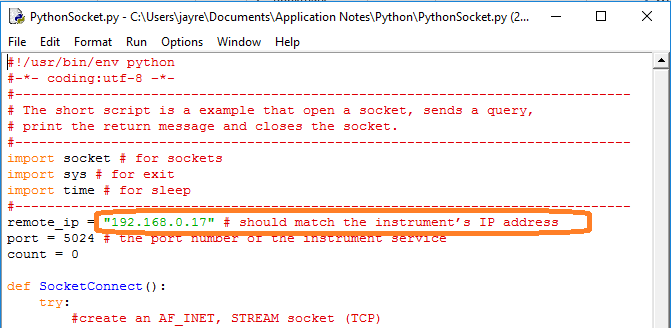
7. Change the IP address and port number so that they match the IP address and port for the instrument you wish to connect to:

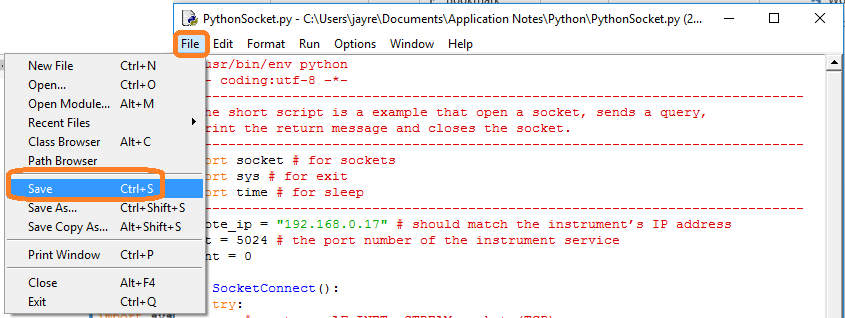
Save the file:

8. To Run, select Run and Run Module:

Verification of a LAN connection using Telnet

Posted on: December 14th, 2020 by Doug Lovell

Automating a test can dramatically increase the productivity, throughput, and accuracy of a process. Automating a setup involves connecting a computer to the test instrumentation using a standard communications bus like USB or LAN and then utilizing code entered via a software layer (like LabVIEW, .NET, Python, etc..) to sequence the specific instrument commands and process data.

This process normally goes quite smoothly, but if there are problems, there are some basic troubleshooting steps that can help get your test up-and-running quickly.

In this note, we are going to show how to use Telnet to test the communications connection between an instrument and a remote computer using a LAN connection to ensure that it is working properly. Once the connection is verified, you can begin to work on the control software.

Telnet provides a means of communicating over a LAN connection. The Telnet client, run on a LAN connected computer, will create a login session on the instrument.

NOTE: The Telnet connection requires open sockets on the instrumentation. At this time, not all SIGLENT products feature open sockets. Check the product page FAQs or with your local SIGLENT support office for more information.

A connection, established between the computer and instrument, generates a user interface display screen with SCPI> prompts on the command line.

Using the Telnet protocol to send commands to the instrument is similar to communicating with USB. You establish a connection with the instrument and then send or receive information using SCPI commands. Communication is interactive: one command at a time.

The Windows operating systems use a command prompt style interface for the Telnet client.

STEPS

1. Power on and connect the instrument to the network via LAN

2. Verify that the Gateway, Subnet Mask, and IP address of the instrument are valid for the network you wish to use. This information is typically located in the System Information or IO menu. See the specific instrument user’s guide for more information on LAN settings.

3. On the computer, click Start > All Programs > Accessories > Command Prompt.

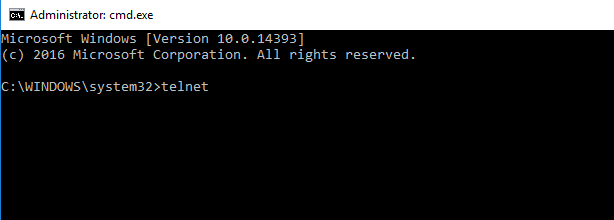
4. At the command prompt, type in telnet.

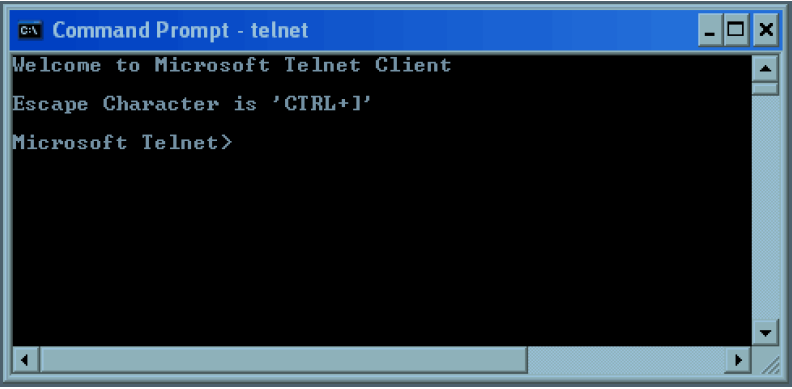
5. Press the Enter key. The Telnet display screen will be displayed.

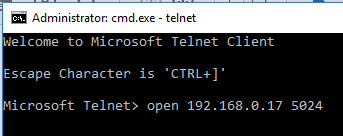
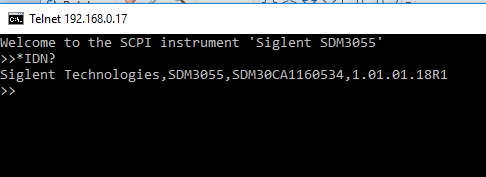
6. At the Telnet command line, type: open XXX.XXX.XXX.XXX 5024 where XXX.XXX.XXX.XXX is the instrument’s IP address and 5024 is the port. You should see a response similar to the following:

7. Now, you can enter any valid command for the specific instrument that you are controlling. See the specific programming guide for the instrument for more information.

This is especially helpful when you are planning a specific test sequence, the effect of delays/timing, or troubleshooting a command. You can send each command one-at-a-time and check the performance of the instrument.

*IDN? is a common identification string query (question or information request) that returns the information from the connected instrument

Measuring Power Supply Control Loop Response with Bode Plot II

Posted on: December 14th, 2020 by Doug Lovell

Stability is one of the most important characteristics in power supply design. Traditionally, stability measurements require expensive frequency response analyzers (FRA) which are not always available in a laboratory. Now, using a Siglent oscilloscope, like the SDS1204X-E with the newly released Bode Plot Ⅱ software, together with a Siglent arbitrary waveform generator (SDG or SAG) and a Picotest injection transformer, the measurement can be made.

In this application note, we will show you the basic principles for making this stability measurement and how to use these instruments to make the measurement.
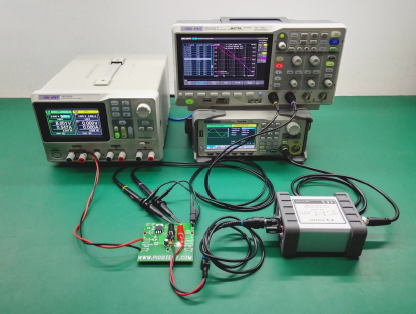
Figure 1: Bode II setup


1. Basic Principle of Stability Measurement


1.1 Stability of The Feedback System

A regulated power supply is actually a feedback amplifier with a large amount of current sourcing capability. Any theory that applies to a basic feedback amplifier also applies to a regulated power supply.

In feedback theory, the stability of a feedback system can be determined by evaluating the loop transfer function. A more practical way is to measure the bode plot of the loop gain. Figure 2 shows a typical feedback system.

The closed loop transfer A is the mathematical relationship between input x and output y. The loop gain T, by its name, is defined as the gain of a signal traveling around the loop.
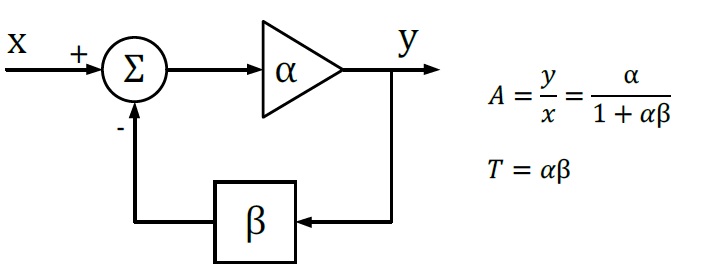
Figure 2: Typical Feedback Loop

Since α and β are complex variables, they have not only magnitude but also phase angle, as also does the loop gain T. If the phase angle of T reaches -180° while the magnitude is 1, the closed-loop transfer function A becomes infinity. In this situation, the system will maintain an output signal while there is no input. Thus, the system acts as an oscillator rather than as an amplifier, which means that the system is not stable.

If we plot the loop gain in a bode plot, we can evaluate the stability by finding the phase margin and gain margin. A phase margin is defined as how many degrees the phase can be decreased before reaching -180°while the magnitude is 1 (or 0 dB). The gain margin is defined as how many dB in magnitude can be added before reaching 1 (or 0 dB) while the phase is -180°.
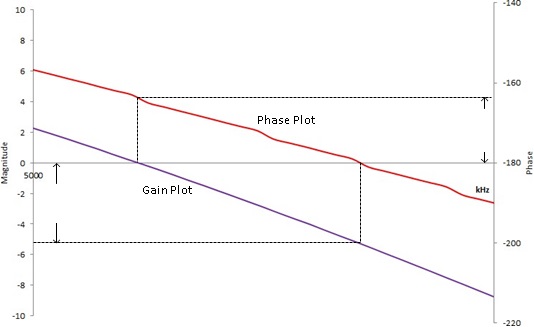
Figure 3: Bode Plot, phase, and gain margin


1.2 Break the Loop

To get the desired loop gain, we simply break the loop. Figure 4 shows how to break the loop in a typical feedback system. Technically you can break the loop any place you like. We commonly choose to break the loop at the point between the amplifier output and the feedback network. Then we insert a test signal i to travel around the loop. The loop gain is the mathematical relationship between the output y and the test signal i.
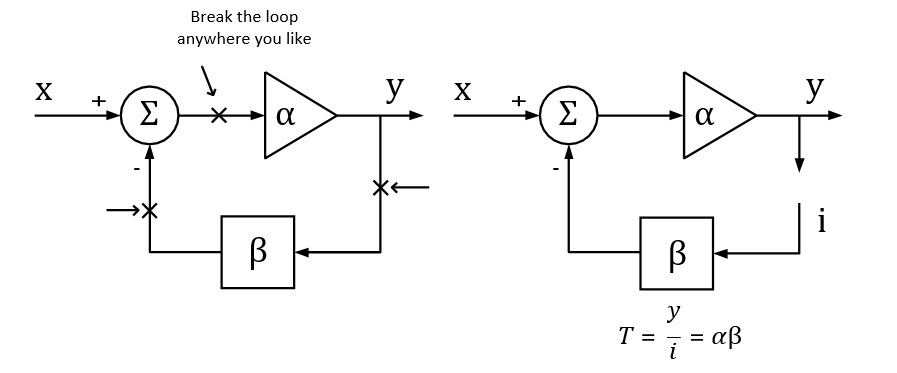
Figure 4: Breaking the loop in a typical feedback system

1.3 Loop Injection

In reality, we can never really break the loop because the feedback loop serves to maintain the DC quiescent operation point of the circuits. Without the feedback loop, the device under test will become saturated because of the small input offset voltage, and then no useful result can be measured.

To overcome this, we should measure the open loop response inside a closed loop. Therefore, we just inject a signal to the loop rather than breaking the loop. Figure 5 shows a typical method of loop injection. The injection point is chosen so that the impedance looking in the direction of the loop is much higher than that looking backward. One possible point is between the output and the resistor divider feedback network. Other points that meet this requirement may be chosen.
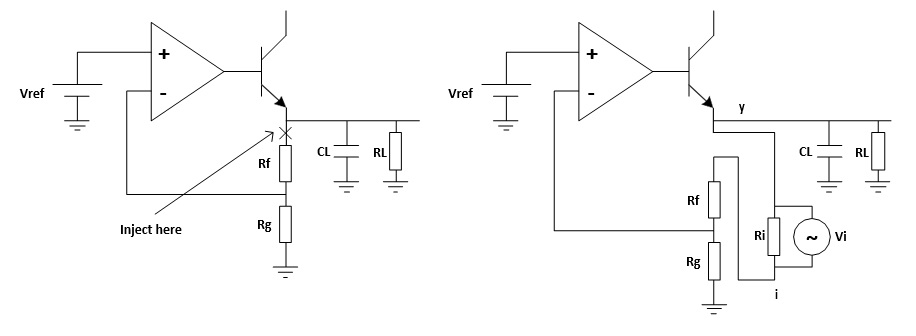
Figure 5: Loop injection

To maintain the closed loop, a small injection resistor Ri is inserted at the injection point. The resistor should be small enough so that it will have little effect on the circuit and also the lower the resistor value the lower the frequency the transformer will operate. Picotest recommends a resistor value of 4.99 Ω for the J2100A, and larger value may be chosen depending on the circuits. The injection signal is then applied across the injection resistor.

The signal injected should have no effect on the DC operating point of the circuit. A method to solve the common ground connection problem is to use an injection transformer as shown in Figure 6.
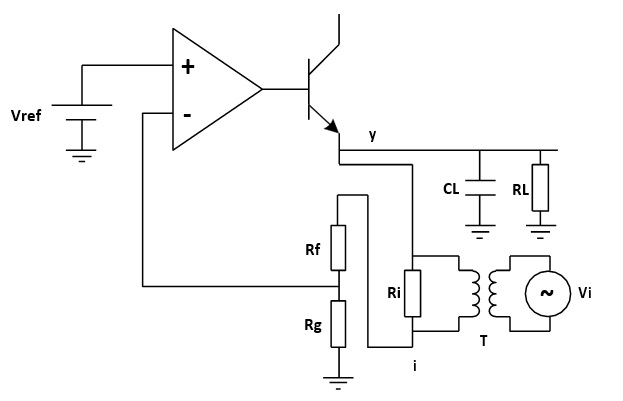
Figure 6: Injection Transformer

The injection signal starts at one end of the injection resistor, travels through the resistor divider feedback network, the error amplifier and the pass element transistor and finally to the output, which is the other end of the injection resistor. The relationship between the injection signal i  and the output signal y is the loop gain that we wish to measure.

Be aware that we are measuring an open loop parameter inside a closed loop, the phase starts at 180°and decreases to 0°, rather than starting at 0°and decreasing to -180°. So the phase margin should be measured relative to 0°.


2. Measurement Setup and Result


2.1 Equipment

Oscilloscope: Siglent SDS1204X-E with firmware version higher than 6.1.27R1 (Bode Plot Ⅱ release)

Signal Source: Siglent SDG2042X

Power Supply: Siglent SPD3303X

Probe: Siglent PP215 passive probe switched to 1X

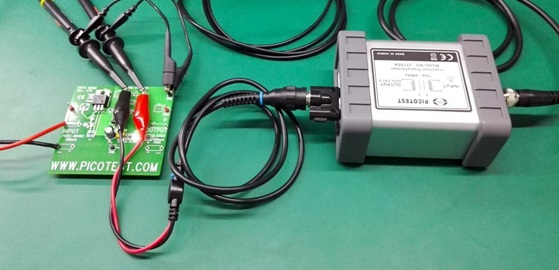
Injection Transformer: Picotest J2100A

Device-Under-Test: Picotest VRTS v1.51


2.2 Circuit Connection

The Picotest VRTS v1.51 is a demonstration board for voltage regulator testing. Technically it is a linear regulator built from the famous TL431 and a discrete transistor. The schematic is shown in Figure 7. Different output capacitors can be selected to see the impact on the control loop stability.
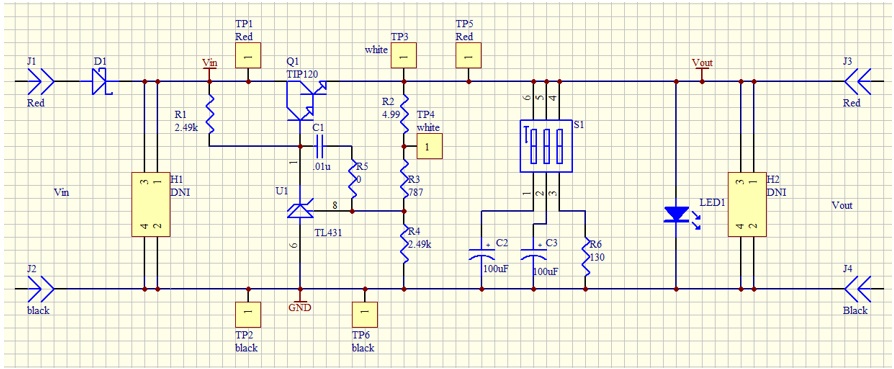
Figure 7: VRTS v1.51 schematic

For the propose of our power supply control loop response measurement, the injection point is TP3 and TP4. The circuit connection is shown in Figure 8.

The generator is connected to the oscilloscope through USB (connection through Ethernet is also supported).

The injection transformer is connected in parallel with the injection resistor so that the signal is injected to the loop while preventing the circuit DC operation point from being affected by the generator.

The TP3 and TP4 points are also connected to the oscilloscope, and the TP4 is defined as the DUT Input while the TP3 is the DUT Output in the Bode Plot Ⅱ.
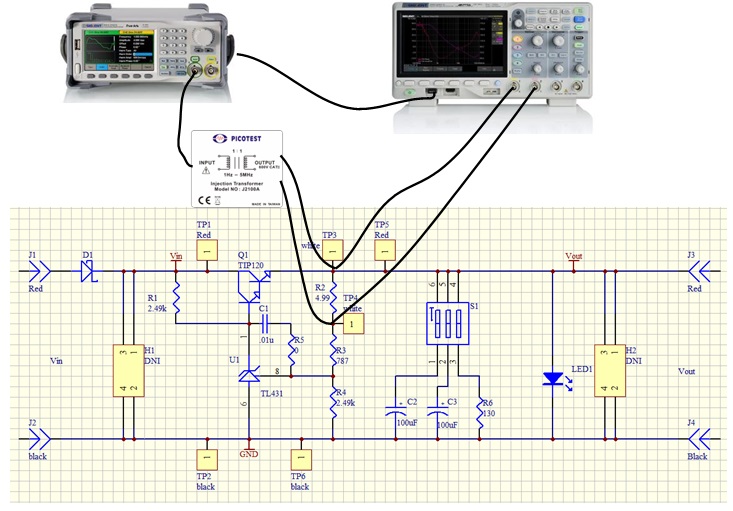
Figure 8: Circuit connection


Figure 9: Probe and Transformer connections to the DUT


2.3 Instrument Configuration

In this section, we will show how the key configuration should be made in order to make the measurement correctly. For complete instructions to the Bode Plot Ⅱ, please refer to the user manual and the quick start guide.

Before entering the Bode Plot Ⅱ, it is recommended that you enable the oscilloscope’s 20 MHz bandwidth limit setting.

At this time, we want to measure the bode plot from 10 Hz all the way to 100 kHz. This frequency range should be enough for a circuit with an expected crossover frequency at about 10 kHz.

Enter the Config menu and set the Sweep Type to Simple, then enter Set Sweep to set the sweeping frequency. Set the Mode to Decade and Start to 10 Hz, Stop to 100 kHz. Set Points/dec to 20, enough for a typical sweep. Enter the Set Stimulus menu to set Amplitude to 50 mV. Enter the Set Channel menu to set DUT Input to CH1 and DUT Output to CH2.

Figure 10: Bode II scope configuration

2.4 Results and Data analysis

After the configuration is done, return to the main menu and press Run to start the sweep.

Wait to see the results as shown in Figure 11.

The result is somewhat confusing and suspect because of the trace at low frequency, especially the phase trace, alternating up and down. We will introduce a method called Vari-level to resolve this problem in the next section.
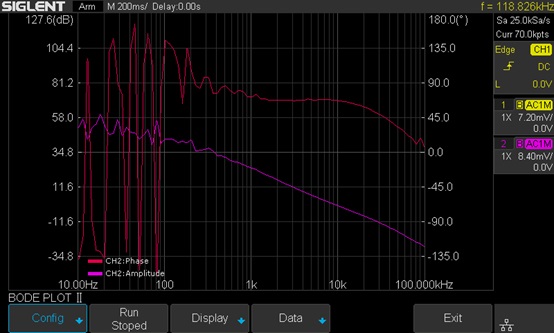
Figure 11: Measurement results

After the sweep has completed, press Run again to stop the sweep. Enter the Display menu and then enter the Cursors menu to turn on the cursors. Use the Adjust knob to move the cursors and set the phase margin as shown in Figure 12.
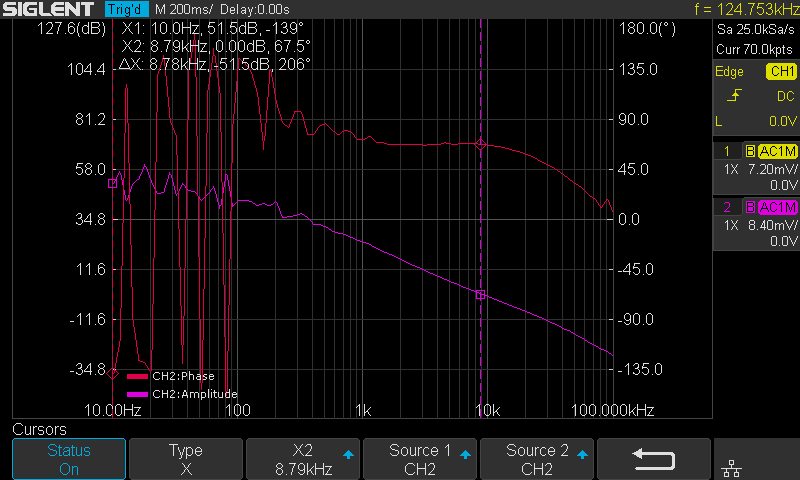
Figure 12: Cursor measurement on the Bode plot

You can also turn on the List feature in the Data menu to examine the measured data, or you can export the data to an external USB FLASH driver for further analysis on a computer.
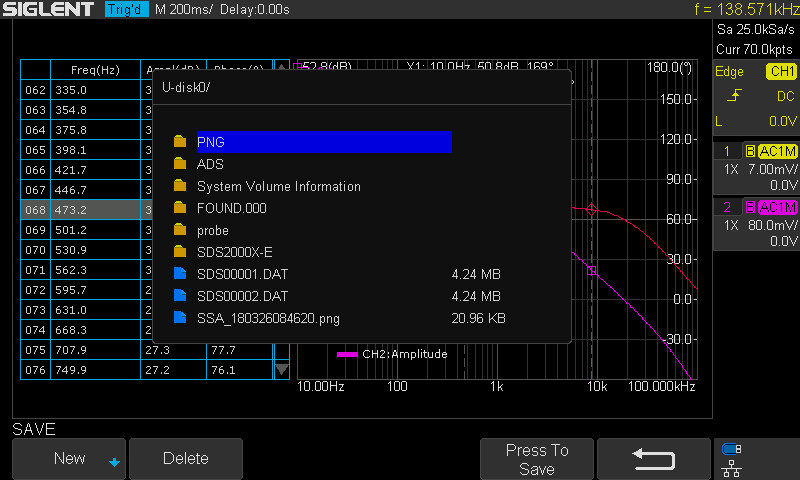
Figure 13: Exporting data

2.5 Vari-level

In the previous section, we can see that the results are not ideal, for the bouncing trace at low frequency. This is because at low frequency the amplitude difference between the input and output channel is relatively large, and since we are using a relatively small stimulus signal (this time 50 mVpp), the signal presented at the DUT Input channel is extremely small so that a commercial general propose oscilloscope cannot measure it accurately.

But we cannot simply increase the stimulus’ signal amplitude. The result will be similar to what is shown in Figure 14. The large signal near the crossover frequency region causes serious distortion to the loop. The distorted signal in the time domain is shown in Figure 15.

Remember that a bode plot only makes sense in a linear system, and has no meaning in a heavily non-linear system. The result is useless.
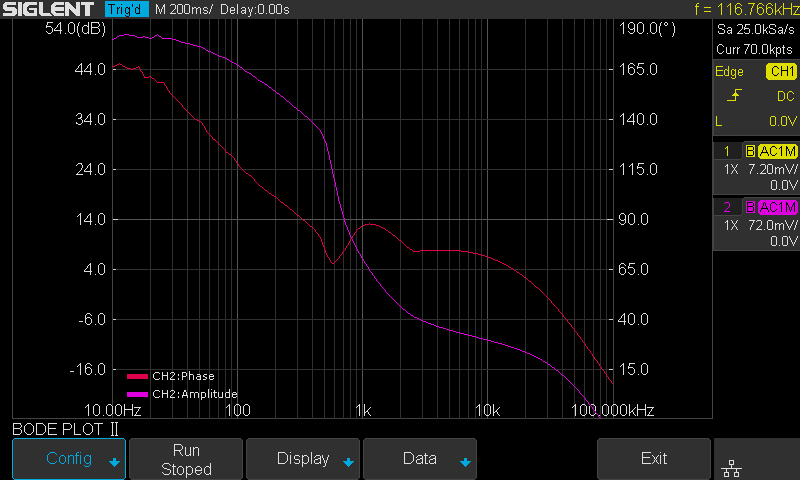
Figure 14: Increased stimulus signal amplitude and distortion

Figure 15: Distortion in the time domain

One possible solution to the problem is Vari-level (other manufactures may call it “Shaped Level” or “Level Profile”). The Vari-level concept is simple: The stimulus signal amplitude is variable over the frequency. If we use a large signal at low frequencies, and decrease the amplitude to a fairly small level near the crossover region so that it causes little distortion to the loop, in theory, we can get an ideal result.

Under the Configure menu, set Sweep Type from Simple to Vari-level, and push Set Vari-level to enter the Vari-level profile editor.

Figure 16: Set Sweep Type to Vari-level

Figure 17 shows the Vari-level profile editor. The Profile option allows the user to select and save up to 4 profiles. The Nodes sets the number of nodes in the profile trace, the minimum allowed number of nodes is 2 because at least 2 points can determine a line, and always the first and the last node set the start and stop of the trace. Press Edit Table will enter the profile editor mode. The parameter under editing is highlighted by cursors, and next push Edit Table again to cycle the cursors between “Freq”, “Ampl” and the entire row, which allows the user to navigate through the entire table. Users can use the Adjust knob to set the highlighted parameter, and pushing the knob will call out a visual keypad which allows direct input to the parameter. The Set Sweep and Set Stimulus option is somewhat similar to that in the Simple type of sweep, but they are not correlated. This time we set the sweep Mode to Decade and a 40-point-per-decade is sufficient. The profile shown in Figure 17 is used in this measurement. It is not the optimum profile for this circuit but should be a good place to start.

Figure 17: Vari-level profile editor

In practice, one should always experiment with those parameters to find an optimum solution for a particular circuit.

One practical way to do this is to monitor the signal in the time domain, decrease the amplitude of the stimulus signal until no visible distortion can be observed, then decrease the amplitude by another 6 dB. Next, record the amplitude and frequency, jump to another frequency and repeat the process.

There is a better way to find the optimum profile if you already have a known good profile. Reduce the signal amplitude by 6 dB and run a sweep to see if the plot changes. If it does change, reduce the amplitude by another 6 dB and sweep again. Until the result doesn’t change, then you can increase the amplitude by 6 dB and that’s an optimum profile. This is time-consuming but necessary to get a meaningful result.

Once profile editing is completed, return to the main menu and push Run to start the sweep. Figure 18 shows the final result of the measurement with Vari-level. Changing the capacitor selection switch S1 on the VRTS v1.51 demo board will alter the loop response due to the impact of different capacitors.
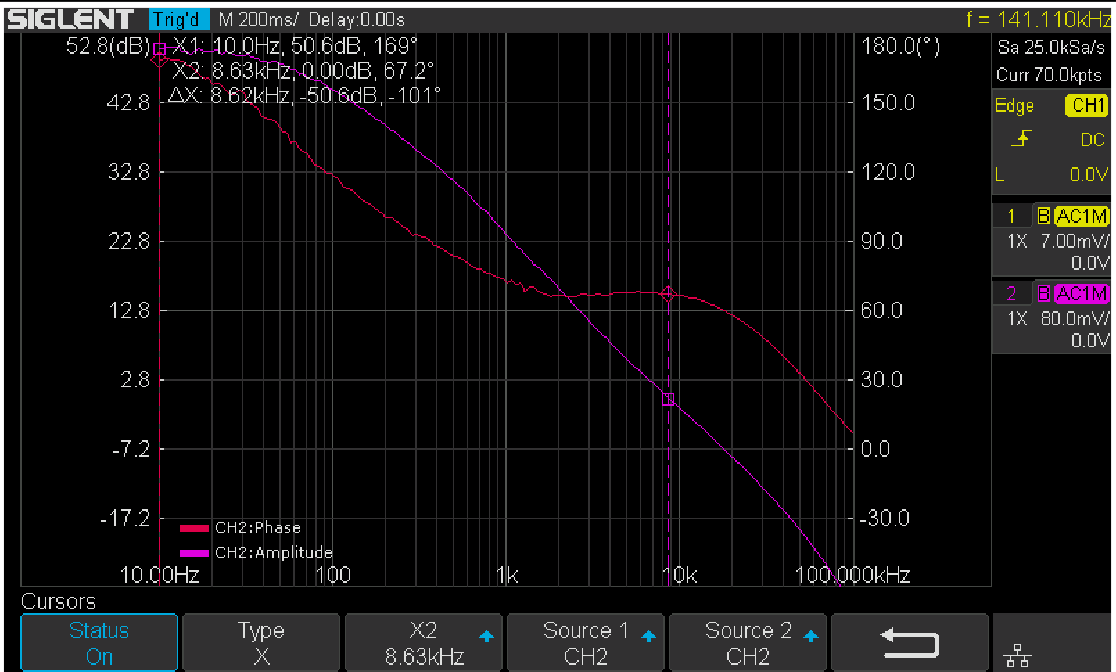
Figure 18: Results with Vari-level

3. Summary

The Siglent oscilloscope with newly released Bode Plot Ⅱ together with a Siglent signal generator and a Picotest injection transformer offer a very flexible and easy-to-use power supply control loop measurement system.

Using EasyScope X to retrieve Average Waveform Data

Posted on: December 14th, 2020 by Doug Lovell

Waveform averaging can be a useful method to decrease noise in a particular signal.

The SIGLENT SDS series of oscilloscopes can easily collect average waveform data using EasyScope X software.

NOTE: At this time, average waveform data is not able to be saved in CSV format via the front panel USB connection to a USB memory stick.

Initial Setup

– Download NI-VISA Runtime Engine that matches your operating system, if your computer does not already have the VISA library.

It can be downloaded from National Instruments: https://bit.ly/2pw5gQW

– VISA library installed. This is the communication library used by EasyScope X software to communicate with the instrumentation

– Download EasySpectrum Software from the SSA3000X Product Page on the SIGLENT America website: https://bit.ly/2okc8wG

Connect and Collect

1. Connect the scope to the computer using a USB or LAN connection and power it on.

NOTE: This example uses a USB connection for communication between the scope and computer.

2. Open an instance of EasyScopeX by clicking on the desktop icon:

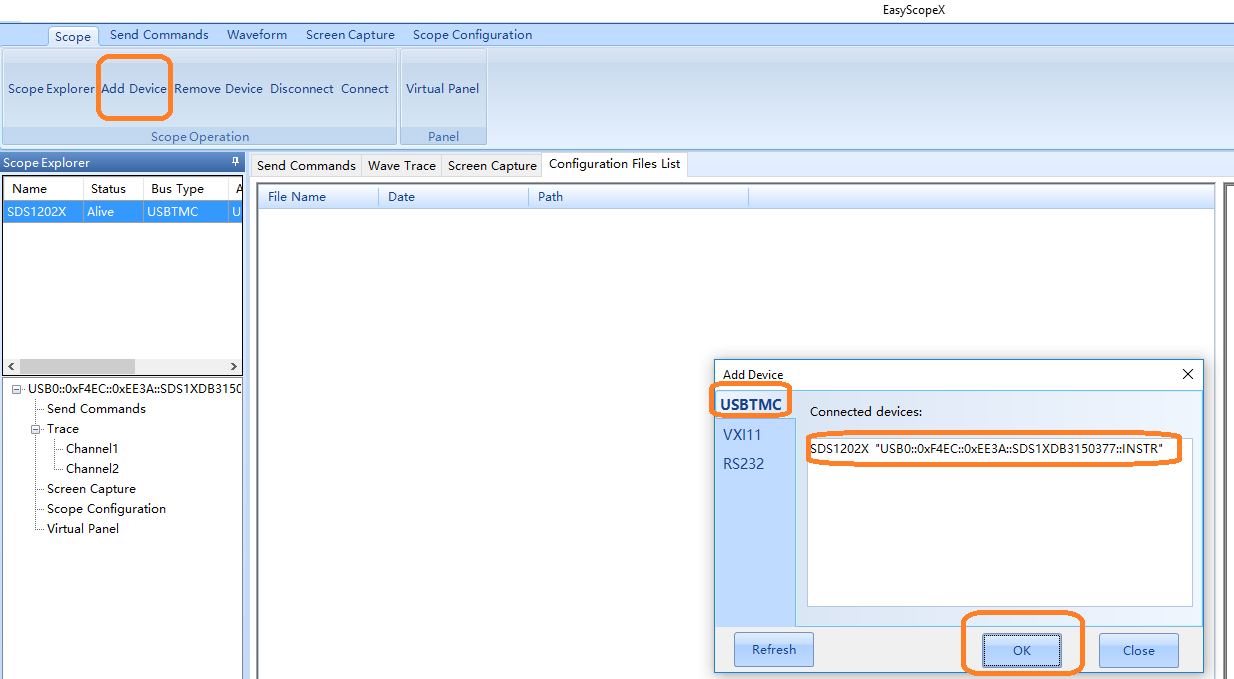
3. Add Device and select the session address for the instrument you wish to connect:

4. Configure the instrument to capture the signal of interest. You can perform this manually on the front panel, or you can use the Virtual Panel control.

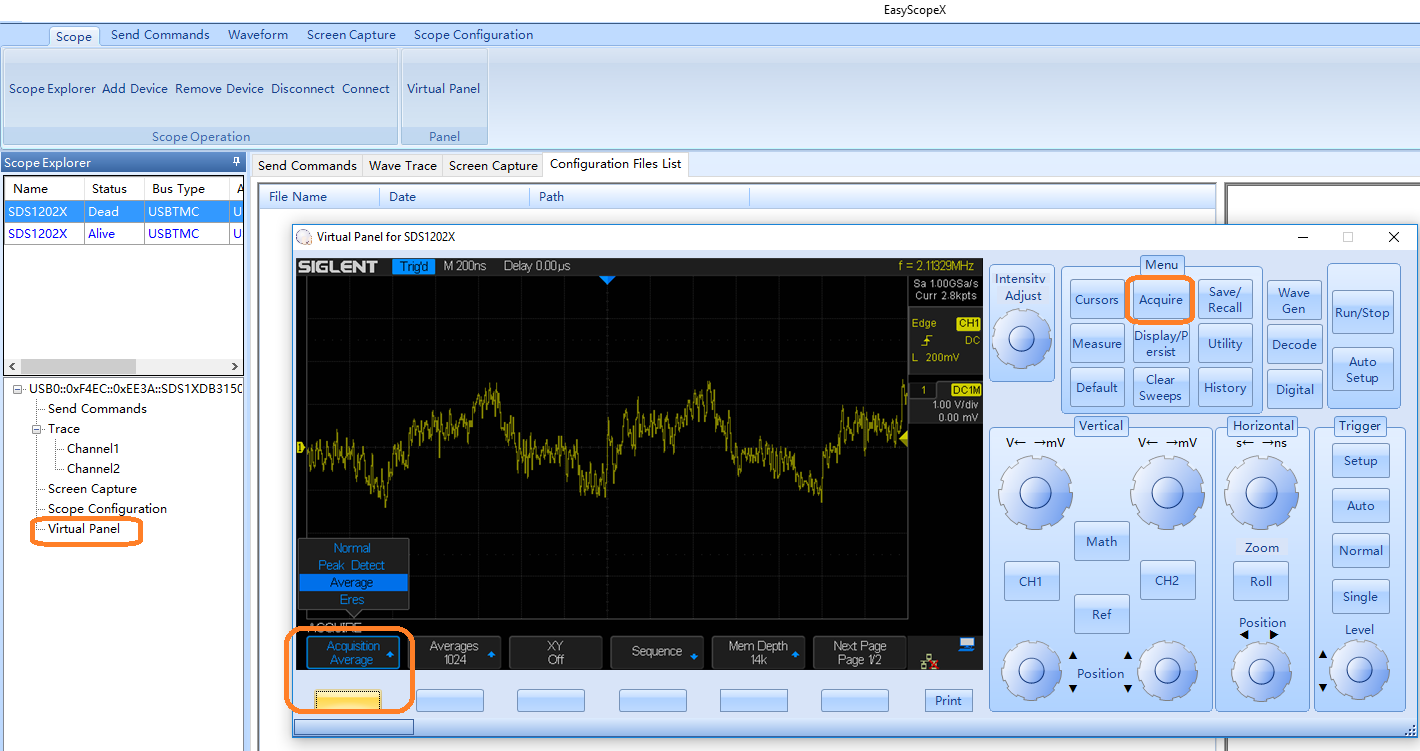
Select Virtual Panel > Acquire > and press the button labeled Acquisition until the type = Average:

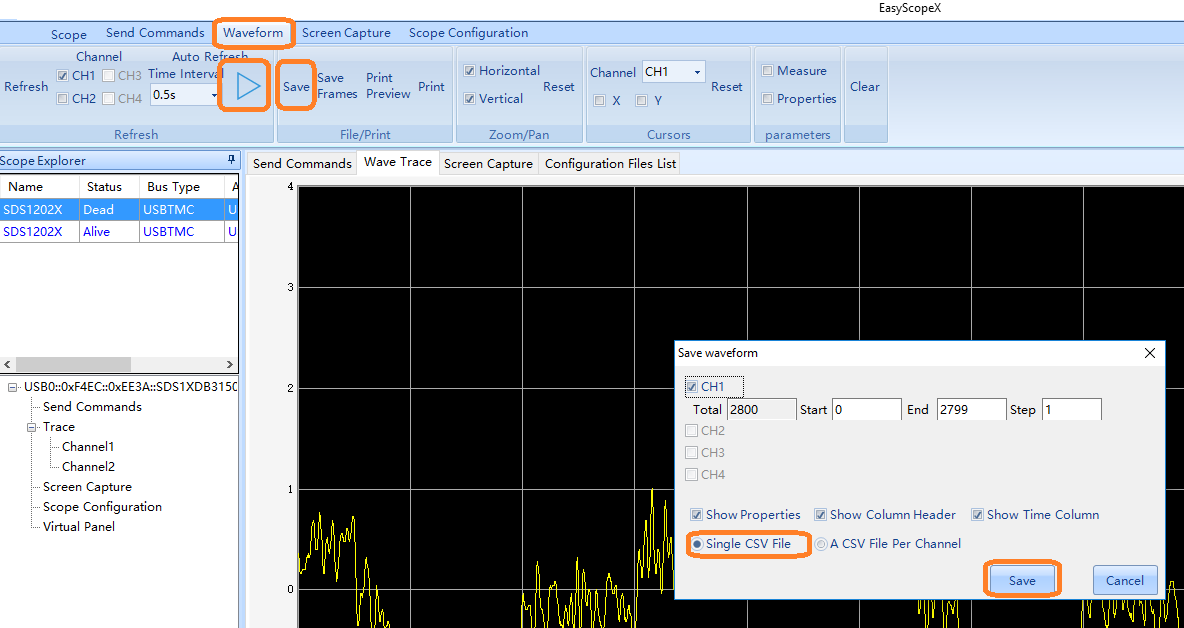
5. Select Waveform, and use the Play/Pause button to acquire the waveform of interest. Then, select Save > select the channel of interest > select the type of CSV to save > Press Save to open a file dialog box.

Quick remote computer control using LXI Tools

Posted on: December 14th, 2020 by Doug Lovell

Introduction:

There are many options for people considering remote communication and control of test and measurement instrumentation. In most cases, a computer is used to communicate to test instrumentation using USB or LAN connections. The computer can configure the instruments, collect and organize data, and present it in a useful and flexible way.

Remote control provides:

  • Increased repeatability: The instrumentation is set up the same way, every time.
  • Efficient data collection: Data can be automatically filtered and stored.
  • Easily configure the test system parameters: Each command is executed in the same order and in the same timeframe.
  • Quickly visualize system performance: Graphical or tabular data formatting is easy.

There are numerous platforms (Windows, Linux, etc..) and software programs (LabVIEW, .NET, Python) available to build automated test systems. The right choice for your application is highly dependent on your needs and the available skills you have.

In this note, we are going to discuss how to use LXI Tools to communicate with SIGLENT instrumentation. LXI Tools is an open source software application that uses the local area network (LAN) connection to quickly control remote instrumentation. It is easy to install, has a small operating footprint, and is really powerful while being quite easy to use. Let’s start by looking at the basics.

You can also see the video version of this note here: https://siglentna.com/video/lxi-tools/

Why Open Source?

Open source coding is a community-based development style in which a group of contributors work together to build and maintain programs using shared code and components. In this way, a platform can be built and tested quickly and may cost significantly less than commercial programming environments. LXI Tools is free open source software and the project welcomes new contributors that would like to help improve the tools.

Here is a link to the LXI Tools website: https://lxi-tools.github.io


Why LXI Tools?

LXI-Tools is a collection of open source software tools that provide direct control of LXI compatible instruments such as modern oscilloscopes, power supplies, spectrum analyzers, and more.Simply install LXI Tools, connect your instrument, and start communicating.

It really is that easy.


LXI-Tools Provides:

  • Quickly discover the available instruments on the LAN
  • Retrieve copies of the displayed images (quickly see signals, data, and instrumentation setups) and convert image file types
  • Benchmark LAN performance
  • Send individual commands to an instrument to perform simple test actions. For example, you could return the measured data from a DMM.

To learn more about LXI-Tools, please see https://github.com/lxi-tools/lxi-tools


Instructions:

  1. Install the appropriate version of LXI-Tools for your operating system


2. Open a terminal. In this example, I am using Ubuntu (17.10) running on a virtual machine hosted by a Win 10/64 bit OS.

To learn more about the virtual machine used in this example:https://www.virtualbox.org/

The OS is Ubuntu: https://www.ubuntu.com/


3. Once loaded, startup Linux:

With Ubuntu, you can use Snap to install:

$ snap install lxi-tools


LXI Discover:

Quickly searches the LAN for instruments and lists their identification string and IP address.

Plug in and power on your instrumentation and make sure that they are connected to a working LAN connection. You can manually check the instrument IP address and save this info to compare to later steps.

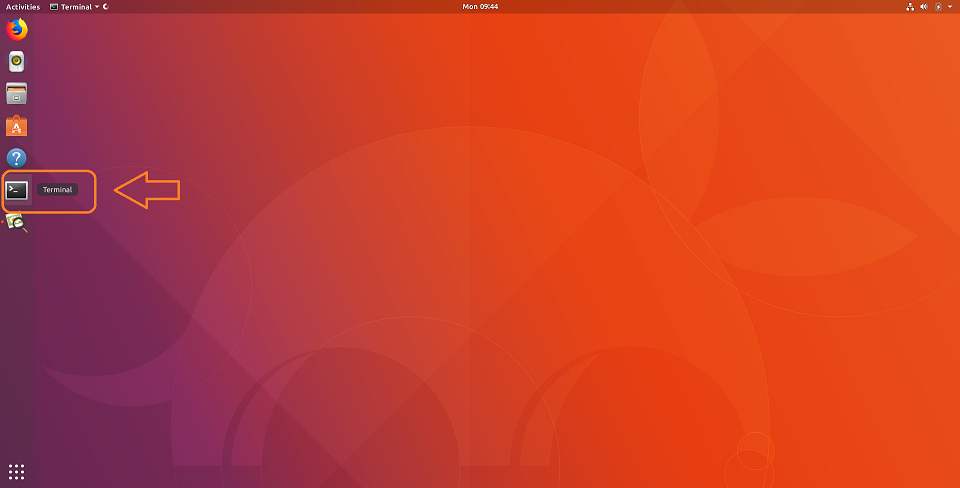
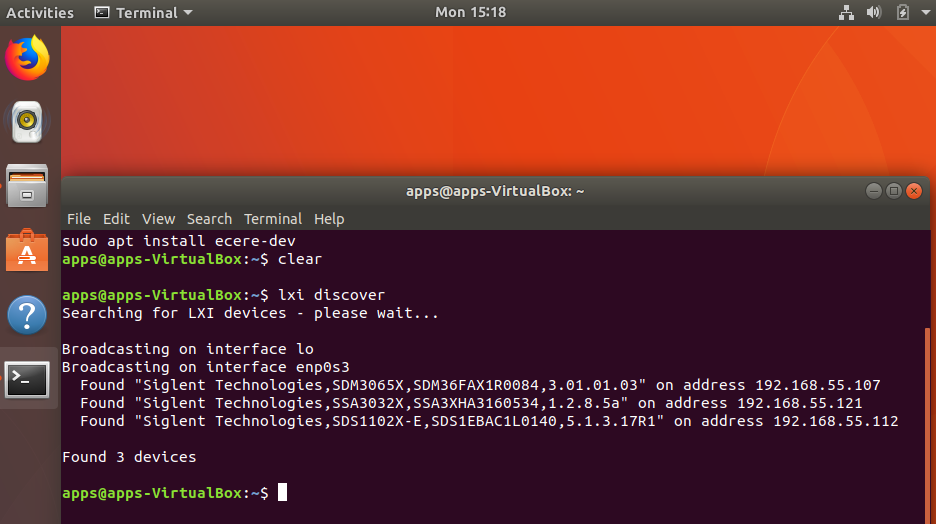
Open up a terminal window.  At the “$” prompt, simply type lxi discover… LXI tools will search the LAN for connected instruments.


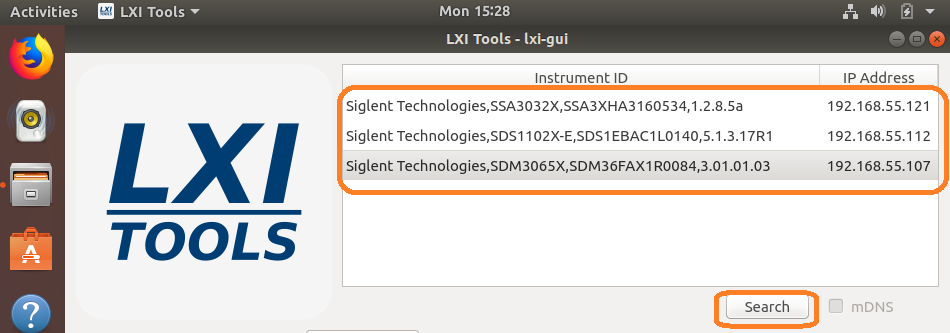
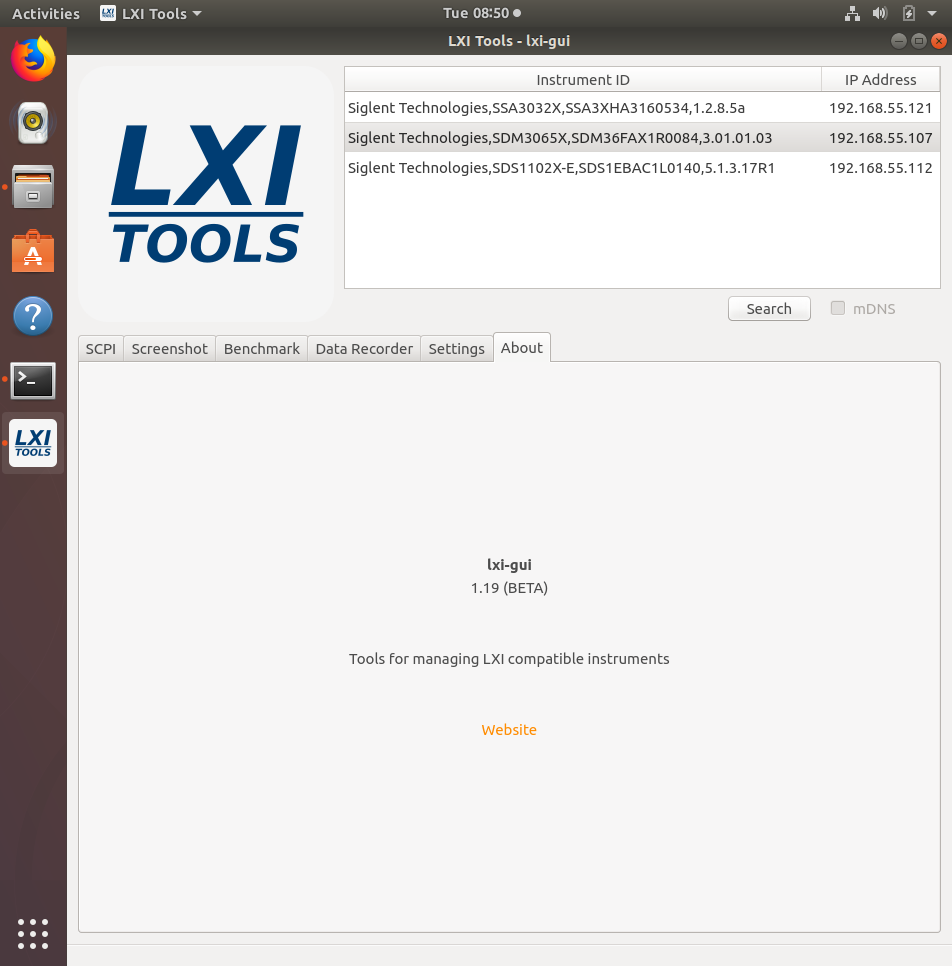
Here, we have three devices connected: an SDM3065X, SSA3032X, and an SDS1102X-E (which has been superseded by the SDS1202X-E series here in North America). It also includes the instrument serial number, firmware revision, and IP address.

NOTE: This has been tested with a large number of instruments, but may not be supported by some. There is a list of compatible instruments at the end of this note or you can check LXI-Tools support for the latest list of supported products.


Screenshot:

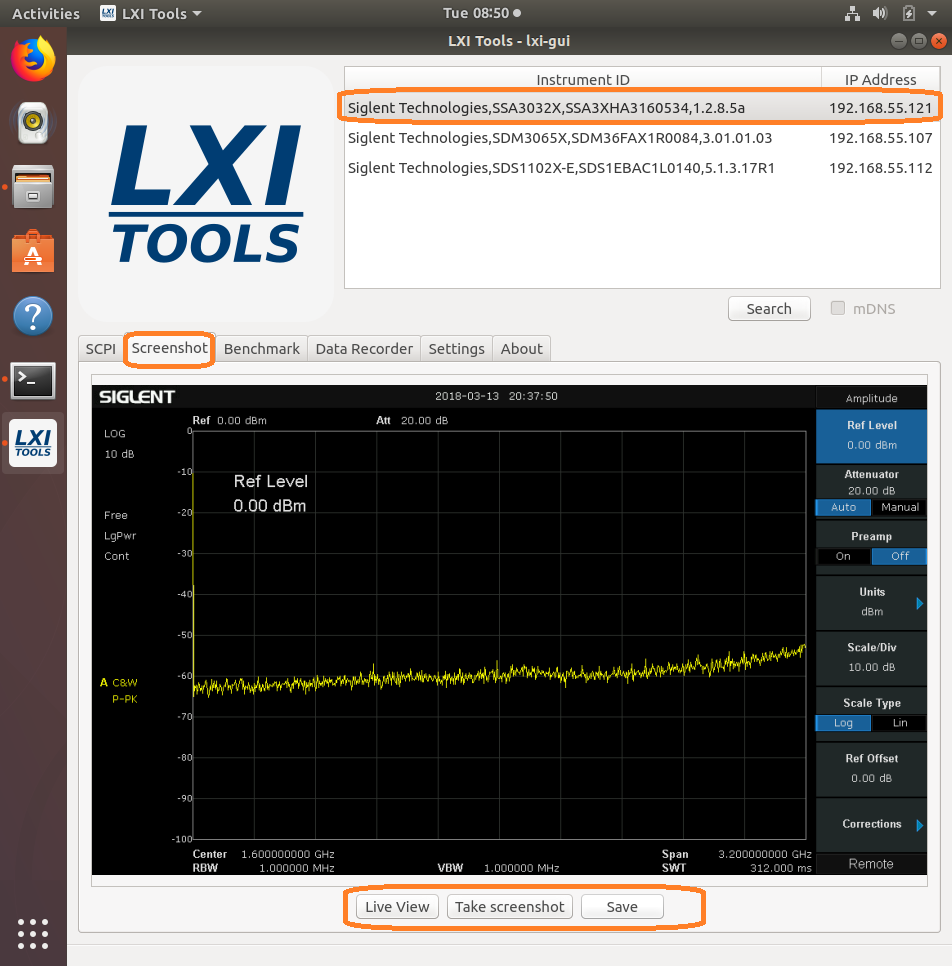
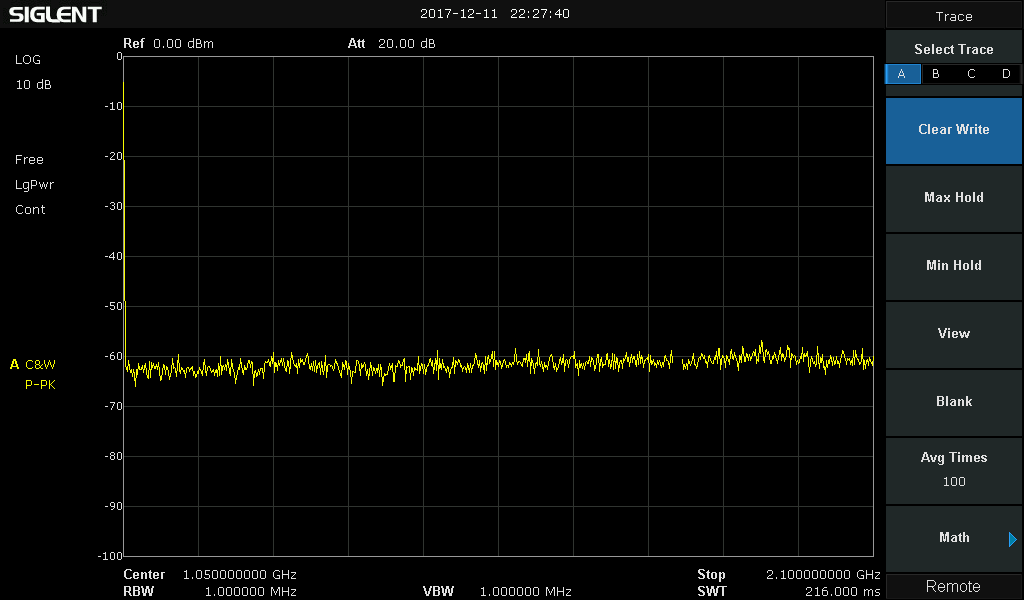
This function retrieves a copy of the instrument display and saves it to the local drive. This is ideal for adding information to reports and sharing events with colleagues.

Type “lxi screenshot – – address <device address>”

NOTE: There should be two “-” with no spaces before “address” for every command.


Image Edits using ImageMagicks

Use ImageMagick® to create, edit, compose, or convert bitmap images. It can read and write images in a variety of formats (over 200) including PNG, JPEG, JPEG-2000, GIF, TIFF, DPXEXR, WebP, Postscript, PDF, and SVG. Use ImageMagick to resize, flip, mirror, rotate, distort, shear and transform images, adjust image colors, apply various special effects, or draw text, lines, polygons, ellipses and Bézier curves.

For more information, visit… https://www.imagemagick.org/script/index.php

$ lxi screenshot –address <ip> – | convert – screenshot.jpg
$ lxi screenshot –address <ip> – | convert – screenshot.tiff
$ lxi screenshot –address <ip> – | convert – screenshot.bmp


Benchmark:

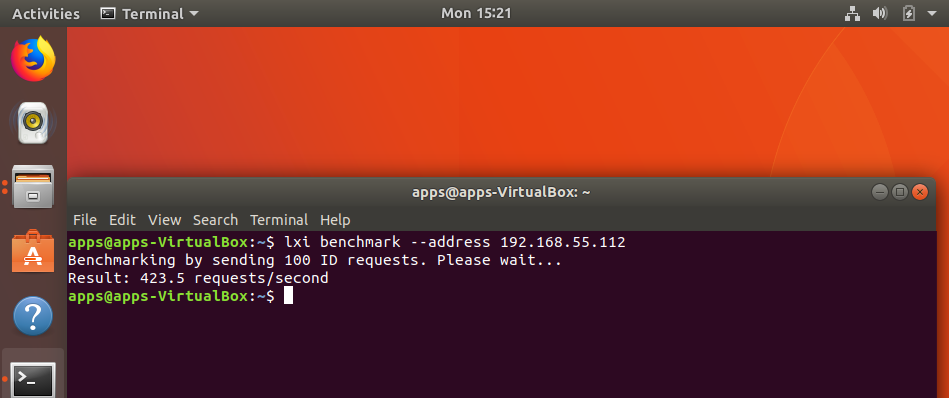
The benchmark command sends 100 requests via LAN and measures the average response time of the instrument. It can be used as a gauge for the health of the connection. Higher response rates = faster links.

$ lxi benchmark –address <ip>


Manual vs. Auto-load:

The commands can also be manually or auto-loaded:

Auto-load/detect:

$ lxi screenshot –address 10.0.0.42

Vs. manually specifying which screenshot plugin to use:

$ lxi screenshot –address 10.0.0.42 –plugin siglent-ssa3000x

The only advantage of manually specifying which plugin to use it that it is a bit faster because it does not go through the instrument auto detection steps (retrieve ID, parse regex rules to match correct plugin etc.).


Sending instrument specific commands:

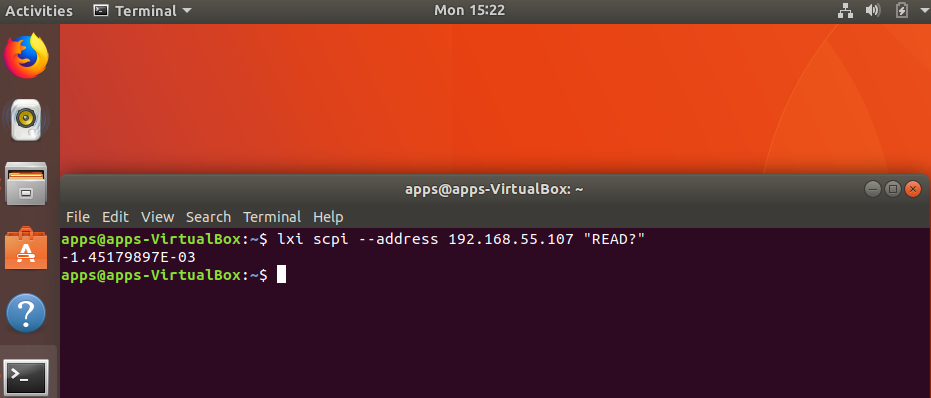
You can also use the SCPI command to send any command to the instrument.

Note that if you have an SCPI command with spaces you must remember to send the specific command in quotes like so:

$ lxi scpi –address 192.168.55.113 “MEAS:VOLT? CH1”

This way the tool knows how to parse the full SCPI string.

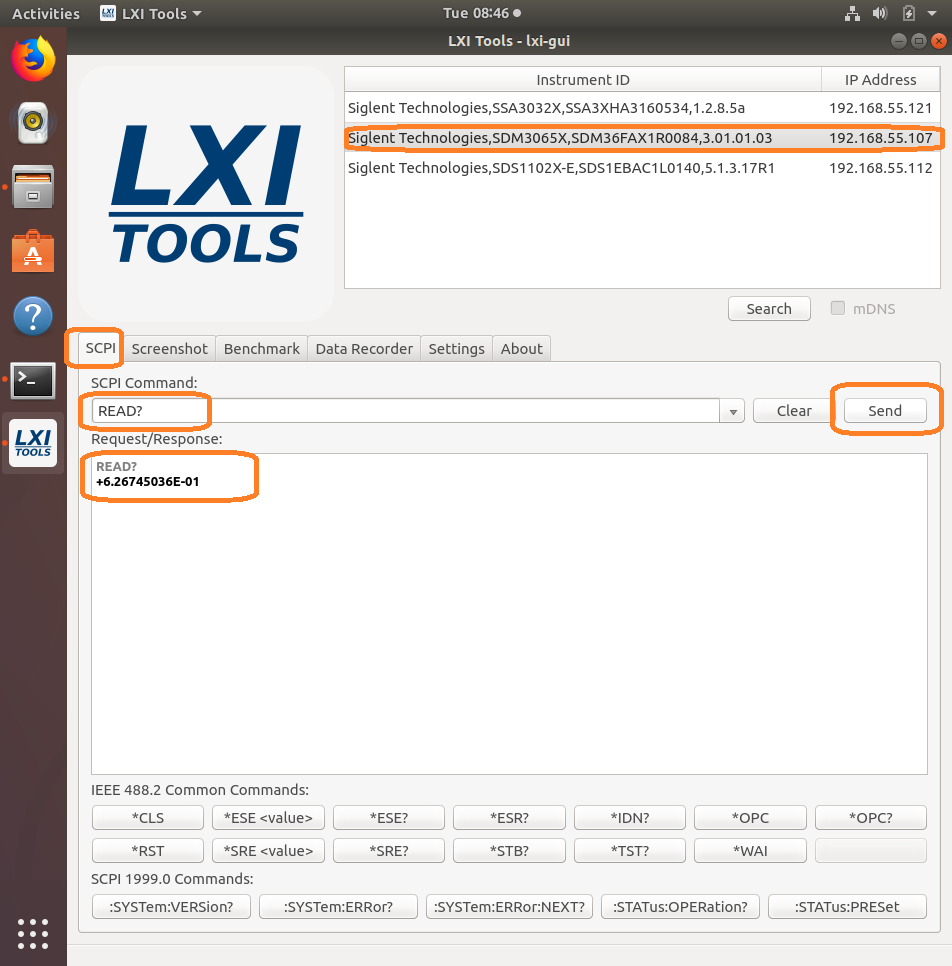
In this example, we send the “READ?” command to an SDM and return a reading:


GUI

Another really great feature is the GUI for LXI Tools. This allows you easy access to discovery of instruments on the network as well as some powerful tools for data capture and instrument control.

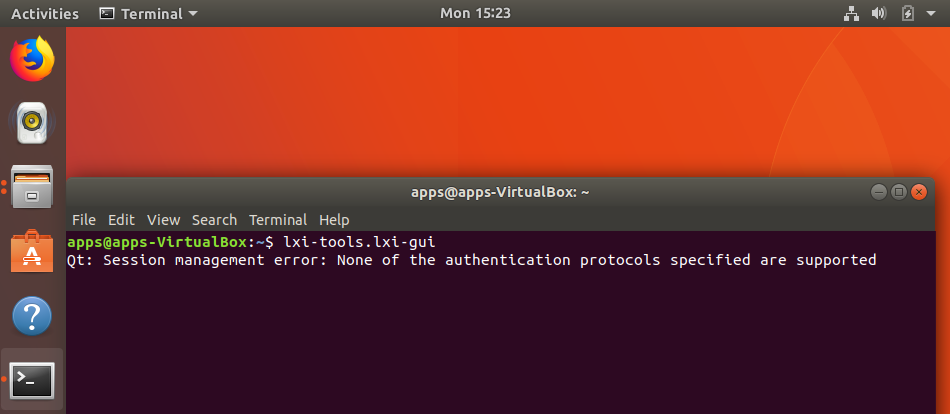
$ lxi-tools.lxi-gui

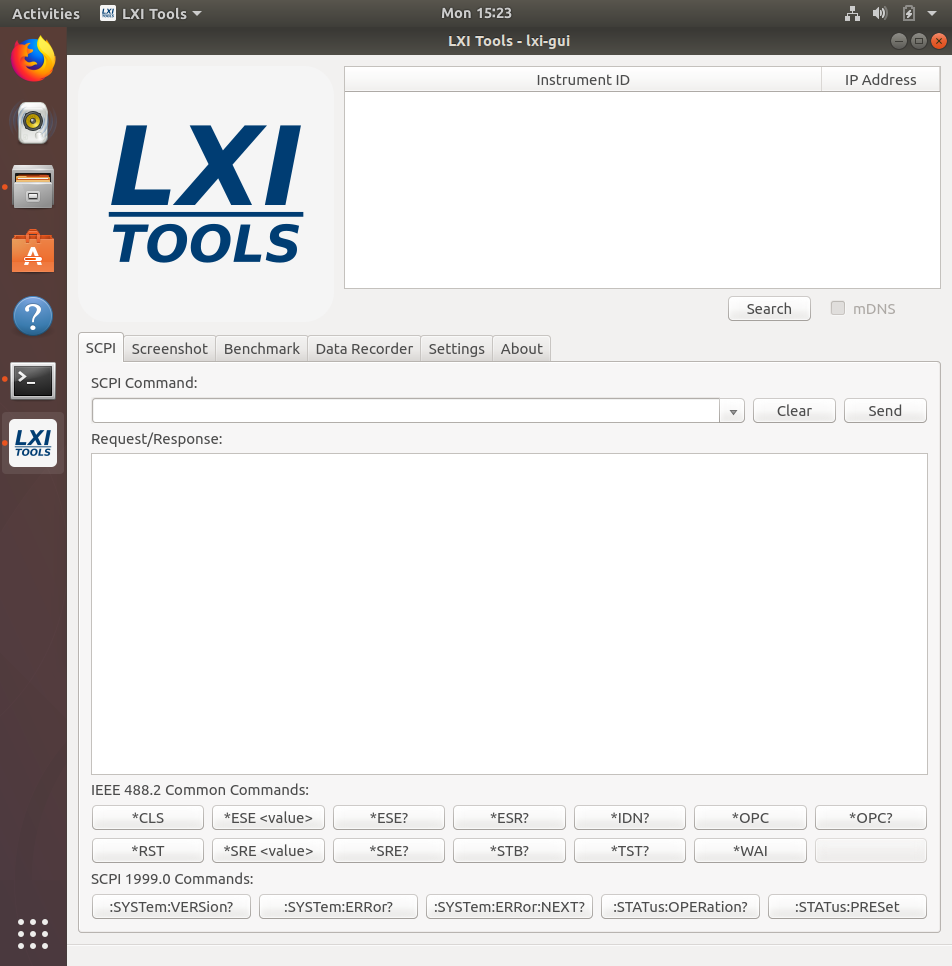
This adds a very simple yet powerful graphical interface for the LXI tools program:


NOTE: Ignore the “Qt” error shown.

This opens a clean control window:


  • Search: Discover the instruments connected to the LAN. Here, we have three instruments connected:


  • SCPI command line: Send instrument specific commands. Click on the instrument you wish to communicate with and then enter the command. For queries (commands that require an instrument response, or read function), the returned string will be shown in the text box:

NOTE: The specific commands that can be used are available in the instrument programming guide. Check out the specific instrument documentation for more details.

This tool can be helpful when trying out specific sequences of commands. You can send them one-at-a-time and then observe the instrument functionality.


  • Screenshot:  Capture and save an image from the instrument. This also features a “live” button that will continuously poll the instrument.


After saving, you can recall the image:


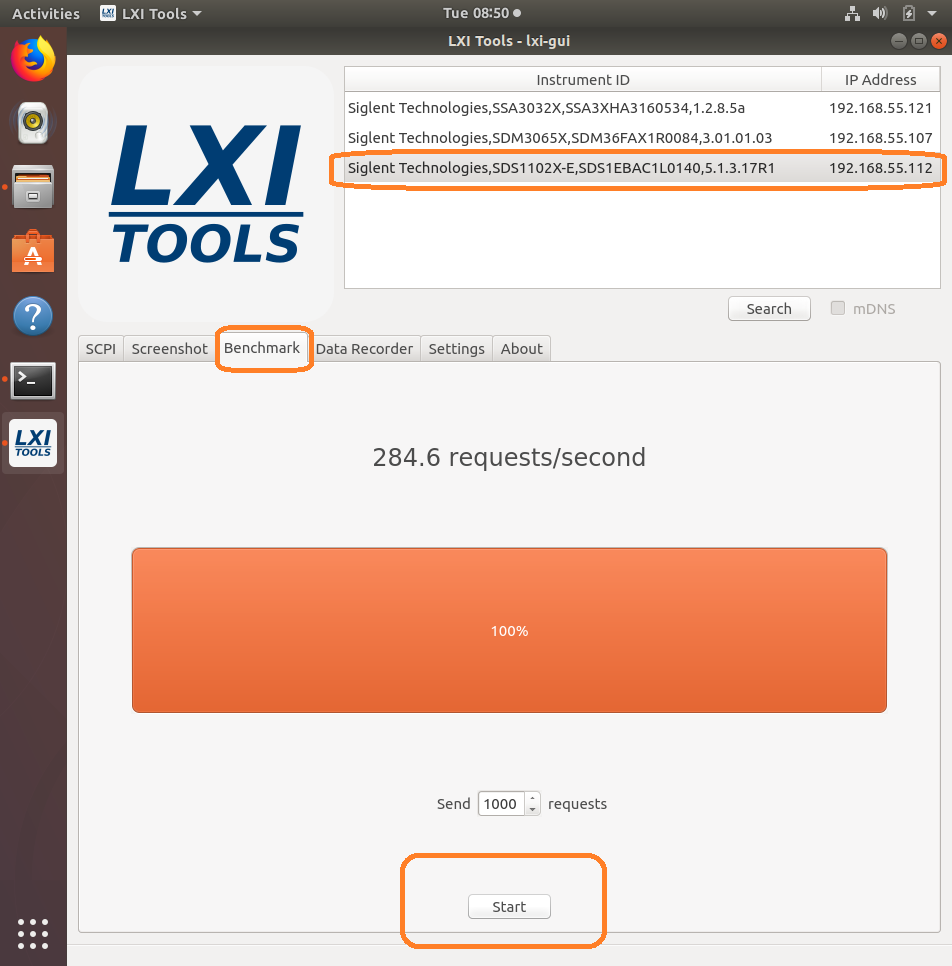
  • Benchmark:  Checks the performance of the LAN  connection by sending a series of commands and measuring the response time. Larger “requests/second” = greater possible bus performance.


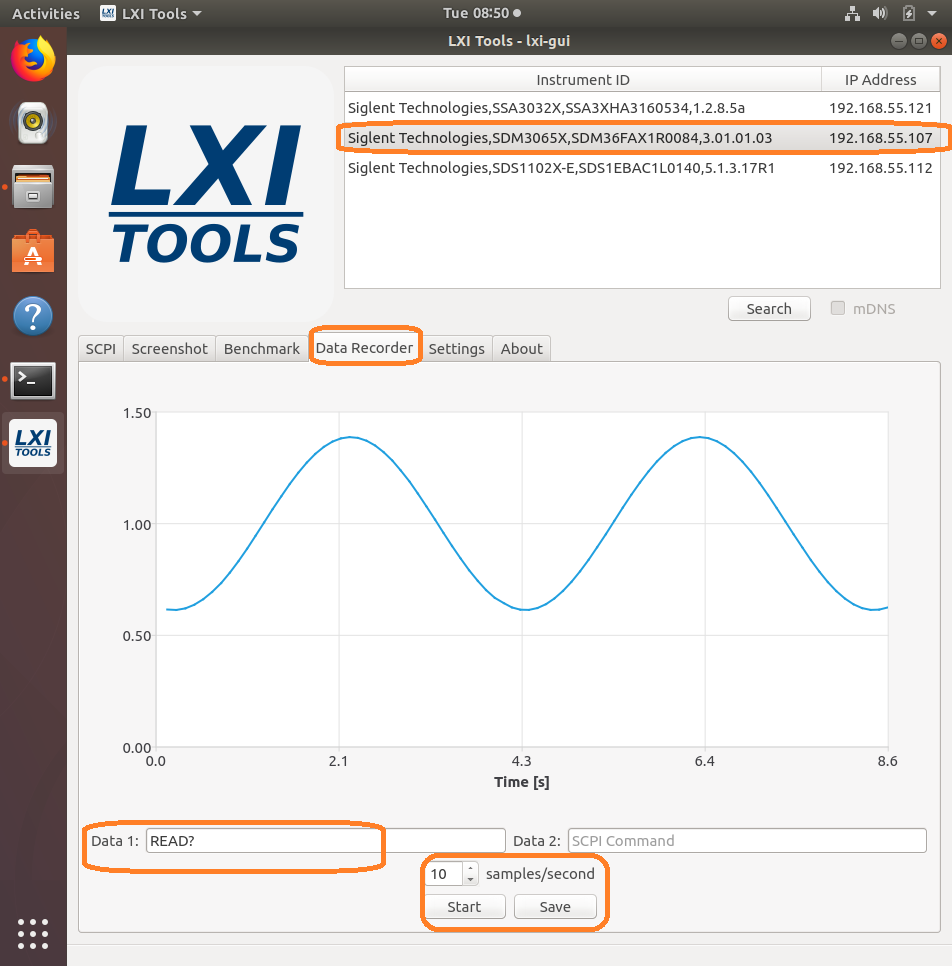
  • Data Recorder:  Sends the user-defined command a number of times/second and attempts to graph the data. Be aware that data can be returned in different formats and at different rates depending on device configuration. Going faster can make the system unstable and could cause a crash or hang-up.


And the data: 


  • Settings: Configure the timeouts and other controls.


  • About:  Version info.


*Here is a list of the latest compatible instruments tested with Lxi-Tools (03/13/2018)

SSA3000X Series:

SSA3000X (Latest 1.2.8.5a)


SDS1000X-E Series:

SDS1202X-E (Older 5.1.3.8R2)

SDS1202X-E (Latest 5.1.3.13)

SDS1204X-E (Latest/first production release 7.6.1.12)


SDS1000X/X+ Series:

SDS1202X+ (Latest 1.1.2.15E3)*

*LIMITED COMMAND SET AVAILABILITY


SDS2000X Series:

SDS2304X (Older 1.2.2.2)*

SDS2304X (Latest 1.2.2.2R10)*

*LIMITED COMMAND SET AVAILABILITY


SDS2000 Series (replaced by the SDS2000X):

SDS2204 (Latest 1.2.2.2)*

*LIMITED COMMAND SET AVAILABILITY


SDM3000 Series:

SDM3045X (Older rev 5.01.01.01)

SDM3045X (Latest rev 5.01.01.03)

SDM3055 (Latest rev 1.01.01.01.19)

SDM3065X (Older rev 3.01.01.02)

SDM3065X (Latest rev 3.01.01.03)


SDG1/2/6X Series:

SDG1032X (Latest 1.01.01.22R5)

SDG20122X (2.01.01.23R7)

SDG6052X (Latest 6.01.01.28R1): 405.3

Programming Example: Using VXI11 (LXI) and Python for LAN control without sockets

Posted on: December 14th, 2020 by Doug Lovell

In an effort to meet the demands of remote monitoring and control, modern test instrumentation is leveraging more communications busses and than ever before. Each type of bus can also have numerous layers that can be utilized for specific advantages.

The VXI bus and subsequent software drivers form a convenient software API that can make remote control of instrumentation over LAN quite simple. In fact, it forms the basis of the TCPIP communications used in LXI format that is being implemented across the industry.

For more info on VXI, you can check out the VXI Consortium

VXI has a small installation size and is quite flexible.. especially when compared to VISA based applications. VISA is convenient and does allow for easy bus changes (from GPIB to USB with just a few lines of code), but it is also a large installation that isn’t always easy to use on machines that are not running Windows.

VXI has many flavors.. and can be used with many OS’ and can be used on many instruments that do not have “open sockets” on their LAN connection.

Here is a list of SIGLENT products that have LAN but do not have open sockets:

SDS2000

SDS2000X

SDS1000X/X+

SPD3000X/XE

In this note, we are going to show how to use VXI-11 with Python to control an instrument. This can be used with traditional OS’ like Windows but offer even more when coupled with Linux variants like those running on Rasberry Pis and other single board computers (SBCs).


Configuration

First, you will need to download a few programs..

  • Python: https://www.python.org/downloads/release/python-2714/

NOTE: This technique works with version 2.x and 3.x.. in this example, we will use Python 2.7.14 for Windows 64 bit OS’

  • Python VXI-11: https://github.com/alexforencich/python-vxi11

Once downloaded, you can add VXI-11 to your Python instance..

  1. Open the command line program in Windows. You can find it by searching for “CMD” or by going to the Start Menu >  Windows System > Command Prompt as shown here:

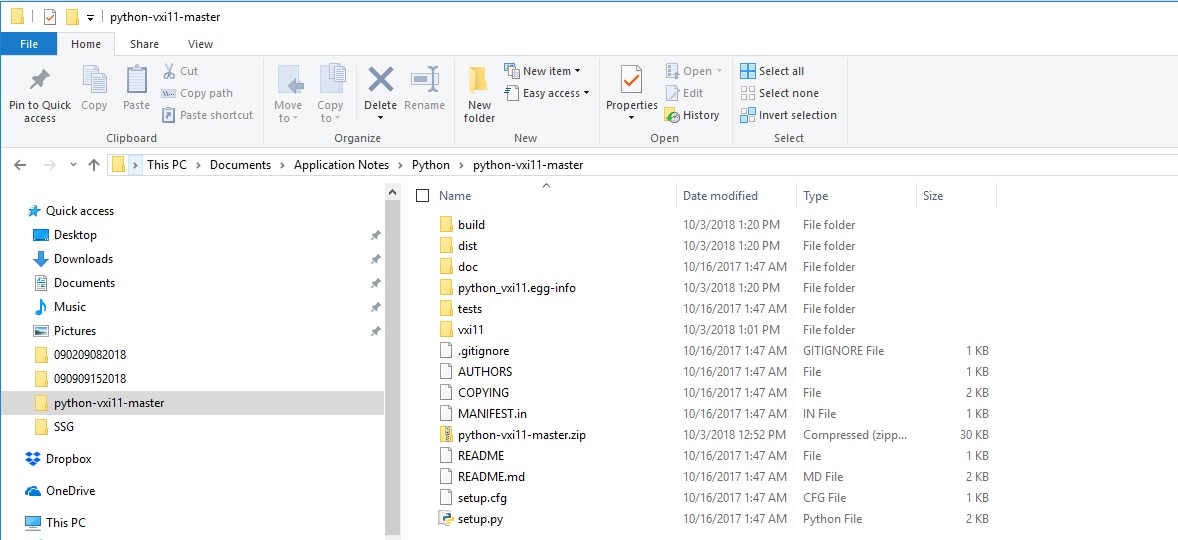
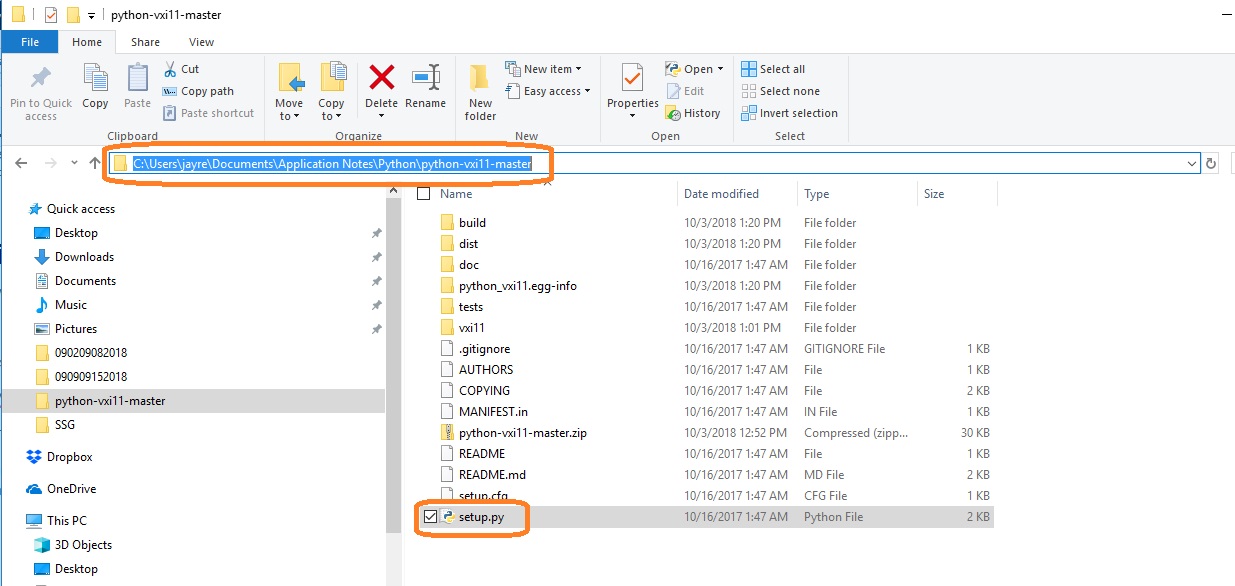
2. In another window, find the location of the Python VXI-11 folder that was downloaded previously and find the path for setup.py. In this case, the path on my PC is shown as:

Now, you can click on the “address” to open the exact path:

Here, I suggest opening Notepad and “copy-paste” the path. It will make the transfer easier:

3. Change the directory in the Command line program to match the path from step 2:

Type “cd <PATH>” as shown:

4. Now, the directory has changed to match the path. You can run the setup.py file by typing “python setup.py install” as shown:

5. Close the Command Prompt

Test the installation

Now that everything has been installed, let’s test the communications link.

  1. Connect the instrument to the LAN of the controlling computer and power it on

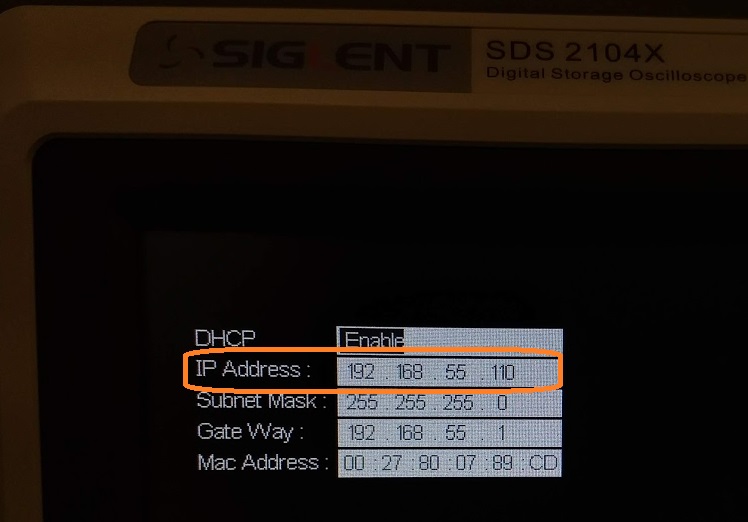
2. Check the IP address for the product (see the User’s Guide of the specific product for more info), In this case, I am using an SDS2000X oscilloscope. Here is the IP address information:

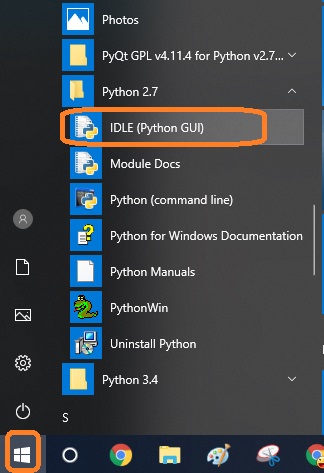
3. Now, start the Python shell. There are a few ways to start this application. In this case, you can find the Python folder in the Windows start folder.

Open IDLE (A Python GUI):

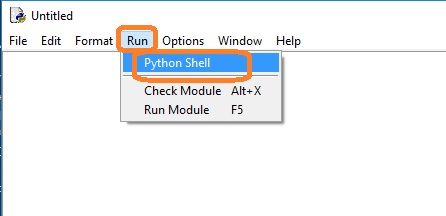
Now, click Run > Python Shell to open the shell:

4. Now, import the VXI11 library by typing “import vxi11”

5. Now, we can assign the variable “instr” to the instrument as shown:

6. Now, we can use the VXI Ask command to send the identification string (*IDN?), request the response, and print it to the screen:

The VXI11 library features a number of functions to handle writing and reading strings and other formats. You can use this technique to establish communications and control the instrument efficiently.


Click here to download a Python file of this example: PythonVXI11_IDN

Programming Example: List connected VISA compatible resources using PyVISA

Posted on: December 14th, 2020 by Doug Lovell

PyVISA is a software library that enables Python applications to communicate with resources (typically instruments) connected to a controlling computer using different buses, including: GPIB, RS-232, LAN, and USB.

This example scans and lists the available resources.

It requires PyVISA to be installed (see the PyVISA documentation for more information)

***

#Example that scans a computer for connected instruments that
#are compatible with the VISA communication protocol.
#
#The instrument VISA resource ID for each compatible instrument
#is then listed.
#
#
#Dependencies:
#Python 3.4 32 bit
#PyVisa 1.7
#
#Rev 1: 08302018 JC

import visa

def main():

rm = visa.ResourceManager()
print (rm.list_resources())

if __name__==’__main__’:

main()

*****

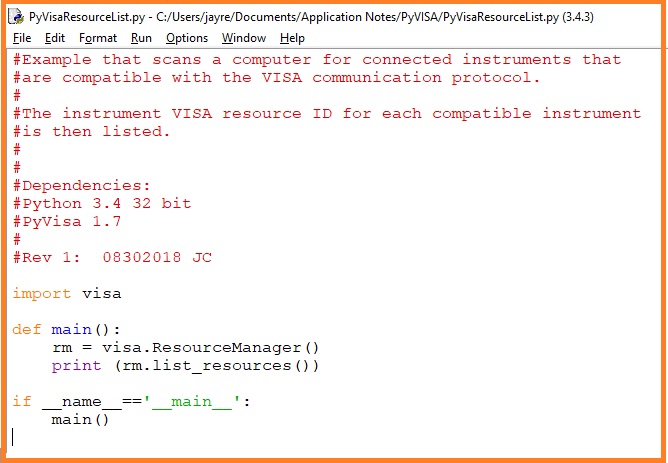
Here is the code:

And here is the result of a scan:

Each connected instrument returns a specific formatted string of characters called the VISA Resource ID.

The resource ID format is as follows:

‘Communication/Board Type (USB, GPIB, etc.)::Resource Information (Vendor ID, Product ID, Serial Number, IP address, etc..)::Resource Type’

In the response, each resource is separated by a comma. So, we have three resources listed in this example:

‘USB0::0x0483::0x7540::SPD3XGB4150080::INSTR’ – This is a power supply (SPD3X) connected via USB (USB0)

‘USB0::0xF4EC::0x1301::SVA1XEAX2R0073::INSTR’ – This is a vector network analyzer (SVA1X) connected via USB (USB0)

‘TCPIP0::192.168.55.122::inst0::INSTR’ – This is an instrument connected via LAN using a TCPIP connection at IP address 192.168.55.122

Programming Example: SDS Oscilloscope screen image capture using Python

Posted on: December 14th, 2020 by Doug Lovell

Here is a brief code example written in Python 3.4 that uses a socket to pull a display image (screenshot) from a SIGLENT SDS1000X-E scope via LAN and save it to the local drive of the controlling computer.

NOTE: This program saves the picture/display image file in the same directory that the .py file is being run from. It will overwrite any existing file that has the same name.

Download Python 3.4, connect a scope to the LAN using an Ethernet cable, get the scope IP address, and run the attached .PY program to save a bitmap (BMP) image of the oscilloscope display.

You can download the .PY file here: Python_Socket_SDS_SCDP.zip

Tested with:

Python 3.4
SDS1202X-E
SDS1104/1204X-E
SDS2000X-E Models
SDS5000X Models

X-Y Display mode on Scopes – additional features with RIGOL DS1000Z-series oscilloscope (DS1074, DS1074Z-S, DS1104Z, DS1104Z-S)

Posted on: December 14th, 2020 by Doug Lovell

New DS1000Z series offers more in X-Y mode:

In this mode, the Rigol DS1074Z oscilloscope changes 2 of the 4 channels from voltage-time display mode to voltage-voltage display mode. The phase deviation between two signals with the same frequency can be easily measured via Lissajous method. The figure below shows the measurement schematic diagram of the phase deviation.

To access the Lissajou mode of your oscilloscope press the horizontal menu button, and then change the time scale on the screen to X-Y mode. From here you can choose between CH1-CH2, CH1-CH3, CH1-CH4, CH2-CH3, CH2-CH4 and CH3-CH4 as your inputs.

NOTE: RIGOL’s new DS1000Z-series offers two features in X-Y mode: you can still see a condensed normal signal display (Y-T) at the top margin of the screen and you can also access the Trigger Menu in X-Y mode.

Which oscilloscope probe is best for my application

Posted on: December 14th, 2020 by Doug Lovell

Selecting the correct oscilloscope probe is very important for making quality measurements. If the probe performance is not adequate or if you did not select the proper probe for your application, you will see distorted or misleading signals on your oscilloscope. There are two kinds of probes, passive and active. Active probes requires power while passive probe do not. For general-purpose measurements(<600MHz), passive high-impedance resistor divider probes are good choices in general. For high-frequency applications less than 600 MHz, active probes are the way to go. They cost more than passive probe and their input voltage is limited, but because of their significantly lower capacitive loading, they give you more accurate insight into fast signals. Selecting the right probe is the first step for your application towards correct measurements. Below is the RIGOL scope probe table which can help you to select a proper probe for your application.

Type
Model
Number
Attenuation
Ratio
Bandwidth
Input R
Max. Input voltage
RIGOL scope Compatility
Recommended
Applications
Passive high resistance probe
RP2200
1:1 or 10:1

1X:DC~7MHz
10X:DC~150MHz

1X:1MΩ±2%
10X:10MΩ±2%
1X:CAT||150V AC
10X:CAT||300V AC
DS1000 series,DS2000 series,DS4000 series,DS6000 series small signal test(1X),
General purpose test
RP3300A
10:1
10X:DC~350MHz 10X:10MΩ±2% 10X:CAT||300V AC
DS1000 series,DS2000 series,DS4000 series,DS6000 series
General purpose test
RP3500A
10:1
DC~500MHz
10MΩ±2% CAT||300V AC DS1000 series,DS2000 series,DS4000 series,DS6000 series General purpose test
RP5600A
10:1
DC~600MHz
10MΩ±2% CAT||300V AC DS4000 series,DS6000 series General purpose test
Passive low resistance probe
RP6150A
10:1
DC~1.5GHz
500Ω±10Ω CAT|7V AC DS4000 series,DS6000 series High frequency signal ended small signal test
Passive high voltage probe
RP1300H
100:1
DC~300MHz
100MΩ CAT|2000V(DC+AC)
CAT||1500V(DC+AC)
DS1000 series,DS2000 series,DS4000 series,DS6000 series High voltage test
RP1050H
1000:1
DC~50MHz
100MΩ DC:0~15KV DC
AC:pulse≤30KVp-p
AC:sine wave≤10KVrms
DS1000 series,DS2000 series,DS4000 series,DS6000 series High voltage test
Active differential probe
RP7150
10:1
DC~1500MHz
Differential mode:50kΩ±2%
Single ended mode:24kΩ±2%
~30V(DC+AC) DS4000 series,DS6000 series Differential/Single ended high frequency signal test
High Voltage differentia RP1025D X20,X50,X200 25MHz Differential :4MΩ/1.2pF
Single ended :2MΩ/2.3pF
Atten X20:
≤140Vpp,(45Vrms or DC)
Atten X50:
≤350Vpp,(110Vrms or DC)
Atten X200:
≤1400Vpp,(450Vrmsor DC)
DS1000 series,DS2000 series,DS4000 series,DS6000 series High voltage differential/Single ended signal test
RP1050D X100,X200,X1000 50MHz Differential:100MΩ/1.2pF
Single ended mode>:50MΩ/2.3pF
Atten 100:
≤700Vpp,(230Vrms or DC)
Atten X200:
≤1400Vpp,(460Vrms or DC)
Atten X500:
≤3500Vpp,(1140Vrmsor DC)
Atten X1000:
≤7000Vpp,(2300Vrmsor DC)
DS1000 series,DS2000 series,DS4000 series,DS6000 series High voltage differential/Single ended signal test
RP1100D X100,X200,X1000 100MHz Differential :100MΩ/1.2pF
Single ended mode:50MΩ/2.3pF
Atten 100:
≤700Vpp,(230Vrms or DC)
Atten X200:
≤1400Vpp,(460Vrms or DC)
Atten X500:
≤3500Vpp,(1140Vrmsor DC)
Atten X1000:
≤7000Vpp,(2300Vrmsor DC)
DS1000 series,DS2000 series,DS4000 series,DS6000 series High voltage differential/Single ended signal test
Model
Number
Gain Bandwidth Gain Accuracy Max.Input Current
RIGOL scope Compatility
Recommended
Applications
Current Probe RP1001C 0.01V/A,0.1V/A DC to 300KHz 100mV/A:±3% ±50mA
(50mA to 10A peak range )
10mV/A:±4% ±50mA
(500mA to 40A peak range)
100mV/A:±15% Max.
(40A to 100A peak range)
DC:±100A
AC P-P:200A
AC RMS:70A
DS1000 series,DS2000 series,DS4000 series,DS6000 series Current test
RP1002C 0.05V/A,0.5V/A DC to 1MHz 500mV/A:±3% ±20mA
(20mA to 14A peak range )
50mV/A:±4% ±200mA
(200mA to 100A peak range)
50mV/A:±15% Max.
(100A to 140A peak range)
DC:±100A
AC P-P:200A
AC RMS:70A
DS1000 series,DS2000 series,DS4000 series,DS6000 series Current test
RP1003C 0.1V/A DC to 50MHz ±1.0%rdg ±1mV, ≤30A
±2.0%rdg , 30A to 50A peak non-continuous
AC P-P:50A peak,non-continuous
AC RMS:30A
DS1000 series,DS2000 series,DS4000 series,DS6000 series Current test,must order RP1000P power supply
RP1004C 0.1V/A DC to 100MHz ±1.0%rdg ±1mV, ≤30A
±2.0%rdg , 30A to 50A peak, non-continuous
AC P-P:50A peak,non-continuous
AC RMS:30A
DS1000 series,DS2000 series,DS4000 series,DS6000 series Current test,must order RP1000P power supply
RP1005C 0.01V/A DC to 10MHz ±1.0%rdg ±1mV, ≤150A
±2.0%rdg , 150A to 300A peak
AC P-P:300A peak,non-continuous
500A Peak,pulse width ≤30us
AC RMS:150A
DS1000 series,DS2000 series,DS4000 series,DS6000 series Current test,must order RP1000P power supply

Using a Rigol product key to generate a Rigol software licence code.

Posted on: December 14th, 2020 by Doug Lovell

Please note…

  • You must enter the product key exactly as it appears on the certificate.
  • The serial number is made up of capital letters and numbers only – There are no lower case letters and no spaces.
  • Please take care when entering the serial number! If you enter an incorrect but valid serial number, the generated software licence code will not be accepted by your instrument.
  • You might find that entering the software licence code into your instrument via the front-panel is rather tedious. Please note that it is possible to enter the code remotely from a PC, using the SCPI control panel within Ultra Sigma. Copying the software licence code from the webpage generator to Ultra Sigma reduces the risk of error. For further information, please refer to the Ultra Sigma Help Document and the Programming Guide for your instrument. Both of these documents and the Ultra Sigma software download can be found on the webpage for your instrument, under the ‘DOCUMENTS, SOFTWARE & VIDEOS‘ tab.
  • For some models it is possible to download the generated software licence code as a ‘.lic’ file, save it to a USB memory stick, then import it into your Rigol instrument from the USB memory stick. For further information, please refer to the User Guide for your instrument.

RIGOL scope has a message on screen saying WAIT (in green). All channels ON but I see no signal being displayed. Is this effect to do with triggering?

Posted on: December 14th, 2020 by Doug Lovell

Yes, you’re right: a WAIT status message is normal behaviour for the Trigger when the scope is not being given quite the right signal for its trigger to fire:
– You’ll probably remember on all analogue scopes, there are at least two modes: Auto and Normal (sometimes also Single).
– Normal is where the trace waits for each trigger before it starts to trace across the screen (we all remember the blank trace on old fashioned scopes, until you put it on Auto!).
– Same with all digital scopes… and because all channels work off same trigger, you won’t see any channels at all.

All RIGOLs indicate this Normal “untriggered” state by putting up the WAIT announcement. It just means the trigger condition is not being met.

There are three things you can do here:
1) Set your trigger mode to Auto
2) Push the force button, which will invoke just one sweep manually
3) If there is any readable signal, you can also keep it on Normal, and simply adjust the whatever is receiving signal, and then use the trigger threshold knob to ensure the dotted trigger threshold line on the screen is within the signal levels (just make sure the trigger is spy-ing on the right channel though!

The advanced trigger types are best avoided too, as they might add more conditions, so just use Edge to begin with.)

Glad to see you are having fun exploring your scope. Please let our RIGOL-UK team here at Telonic know if this seems right for your set up.