Free Shipping logo FREE SHIPPING £75+
50 years of Telonic Instruments Ltd logo CELEBRATING 50+ YEARS
Price Match logo PRICE MATCH GUARANTEE

How can I use Ultra Sigma to grab data from my RIGOL Scope? E.g. CSV file for viewing in Excel?

Posted on: December 14th, 2020 by Doug Lovell

First of all, install and run Ultra Sigma,
– Then make sure you can see your scope (Type shown in the Instruments window of Ultra Sigma)
– AND that the scope response with its serial number to a *IDN? command. (Rt-click on instrument and choose SCPI Panel Control window, then click Send&Receive a *IDN?)

Once this is OK, Change the setting shown as Base to Advanced (U’Sigma setting drop down next to the word Base – then change Base to Advanced)
– Click Options – set Timeout to 12000 (not 2000) and Bytes To Read to 11024 (not 1024).
– Enter in the command line the commands:
i) :WAV:SOUR CHAN1
ii) :WAV:MODE NORM
ii) : WAV:DATA? and click Send&Read after each – a bunch of data should now appear in the window below
– Select the second tab below, called Current Return Value (data window)
– Right-click the data and choose Save Current Data To File-> Save for Byte -> Give your CSV file a name

This CSV file can be opened directly in e.g. Excel, to graph data.

NOTE: This grabs the SCREEN datapoints at the time of executing the :WAV:DATA? query. Works whether scope is running or not!
To grab the MEMORY datapoints (which can be much longer and require different Options settings!!) you must first :STOP the scope and ensure your command is in :WAV:MODE RAW.

How to measure an RF Amplifier using a DSA-800 Series Spectrum Analyser

Posted on: December 14th, 2020 by Doug Lovell

Solution: This document provides step-by-step instructions on using the Rigol DSA-800 series of Spectrum Analysers to measure the characteristics of an RF Amplifier.

In addition to the DSA-800 Spectrum Analyser, you will need an RF Source, cabling, and adapters.

Measure the amplifier

1. Connect the RF generator output to the RF input of the instrument using the appropriate cabling and connectors.

NOTE: If your instrument is equipped with a Preamplifier, you can enable it to lower the displayed noise floor by pressing the following sequence:

Press AMP button > Down Arrow > RF Preamp On

2. You can use the Auto button to center and zoom on the waveform. You can also use the Freq and Span buttons to manually manipulate the displayed data.

Another option to center the waveform is to press Freq button > Peak → CF. This will automatically align the center of the display with the peak of the trace.

3. Freeze the unamplified trace by pressing Trace > Trace Type > Freeze. You can use the Marker button to create a marker. This can be used to find the peak frequency and amplitude of the displayed waveform.

4. Disable the RF Generator output.

5. Disconnect RF generator from the instrument RF Input and connect it to the Amplifer input.

6. Connect the Amplifier output to the instrument RF Input.

7. Enable the RF generator.

8. Enable a second trace to visualize the amplified signal by pressing the Trace button > Select Trace 2.
9. Set the trace type to Clear/Write by pressing Trace > Type > Clear/Write. 10.You can use the Auto button or manually center the trace using the Freq,
Span, and Amp buttons.

11. Readjust the amplitude scale by pressing Amp > Auto

12. You can enable an additional marker for the new trace by pressing Marker > Select the marker you would like to use

13. Now, select the trace you want to mark by pressing Marker > Marker Trace
> select trace of interest

• Be sure Normal is selected to enable the marker

14. You can also enable a marker table by pressing Marker > Down Arrow > Mkr Table ON. This allows a convenient way to compare markers and values between traces.

15. Alternately, you can use the Trace Math function to create a Trace difference on the screen.

16. Enable Trace Math by pressing Trace > Trace Math

17. Set Function to A-B

18. Set A = T1

19. Set B = T2

20. Set Operate > On

21. Set Amplitude by pressing AMPL > Auto

NOTE: New trace appears. This represents Trace 1 – Trace 2.

22. Set Marker to Math Trace by pressing Marker > select Marker 3 23.Set Marker Trace to Math by pressing Marker > Marker Trace > Math

23.Set Marker Trace to Math by pressing Marker > Marker Trace > Math

• You can then move the marker to the smoothest portion of Trace 3

• You can then move the marker to the smoothest portion of Trace 3.

How do I measure an RF Bandpass filter

Posted on: December 14th, 2020 by Doug Lovell

This document provides step-by-step instructions on using the Rigol
DSA-800 series of Spectrum Analysers to measure the characteristics of an RF
Bandpass filter.
NOTE: The DSA must have a Tracking Generator to effectively perform the
following test.
Normalize the trace (Optional)
Many elements in an RF signal path can have nonlinear characteristics. In many
cases, these nonlinear effects on your base measurements can be minimised by
normalising the instrument.
1. Connect tracking generator output to RF input using the same cabling that
you will be using to test your device. Any element, like an adapter, used
during normalization should also be used during device measurement as any
changes to the RF signal path could effect the accuracy of the measurement.
2. Enable the tracking generator by pressing the TG button > TG On
3. Store the reference trace by pressing the TG button > Normalize > Stor Ref
4. Enable normalization by pressing the TG button > Normalize > Normalize
On
Measure the filter
1. Connect the tracking generator output to the filter input using the appropriate
cabling and connectors.
2. Connect the filter output to the instrument RF input.

3. Set the tracking generator amplitude by pressing the TG button and the TG
Amplitude. You can use the keypad or wheel to enter the correct value.

NOTE: If your instrument is equipped with a Preamplifier,
you can enable it to lower the displayed noise floor
by pressing the following sequence:
Amplitude button > Down Arrow > RF Preamp On
4. Enable the Tracking generator by pressing the TG button > RF Source ON
You can see the small bump in the figure below.

Figure 1: Before Auto.
5. You can use the Auto button to center and zoom on the waveform. You can
also use the Freq and Span buttons to manually manipulate the displayed
data.

Figure 2: After Auto.
6. You can now enable the Marker function to measure the bandwidth and
attenuation or passband characteristics of the filter.
7. Press Marker Fctn > N dB BW and set the function to the amplitude of
interest. In this example, we are measuring the 3dB Bandwidth of our filter.

EMC Precompliance: Testing on a budget

Posted on: December 14th, 2020 by Doug Lovell

Solution: Almost any electronic design slated for commercial use is subject to EMC (Electromagnetic Compatibility) testing. Any company intending to sell  these products into a country must ensure that the product is tested versus specifications set forth by the regulatory body of that country. Here in the US, the FCC specifies rules on EMC testing. CISPR and IEC are also used throughout the world.

To be sold legally, a sample of the electronic product must pass a series of tests. In many cases, companies can self-certify, but they must have detailed reports of the test conditions and data. Many companies choose to have these tests performed by accredited compliance company. This full compliance testing can be very expensive with many labs charging thousands of dollars for a single day of testing. Testing a product for full compliance can also require specialised testing environments and no changes can be made during the testing. Any failures in compliance testing require that the design heads back to Engineering for analysis and possible redesign. This can cause delays in product release and an obvious increase in design costs.

One method to lower the additional costs associated with EMC compliance is to perform EMC testing throughout the design process well before sending the product off for full compliance testing. This pre-compliance testing can be very cost effective and can be tailored to closely match the conditions used for compliance testing. This will increase your confidence in passing compliance the first time through, lower your test costs, and speed your time to market.

Measuring Radiated EMI
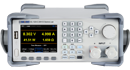
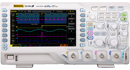
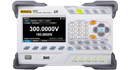
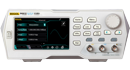
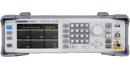
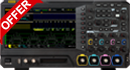
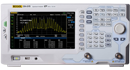
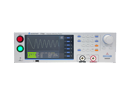
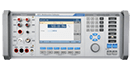
The most simple form of pre-compliance measurements for radiated emissions can be performed using a spectrum analyser, like the Rigol DSA-815 (9kHz to 1.5GHz), and near field electric (E) and magnetic (H) probes.

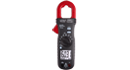
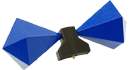
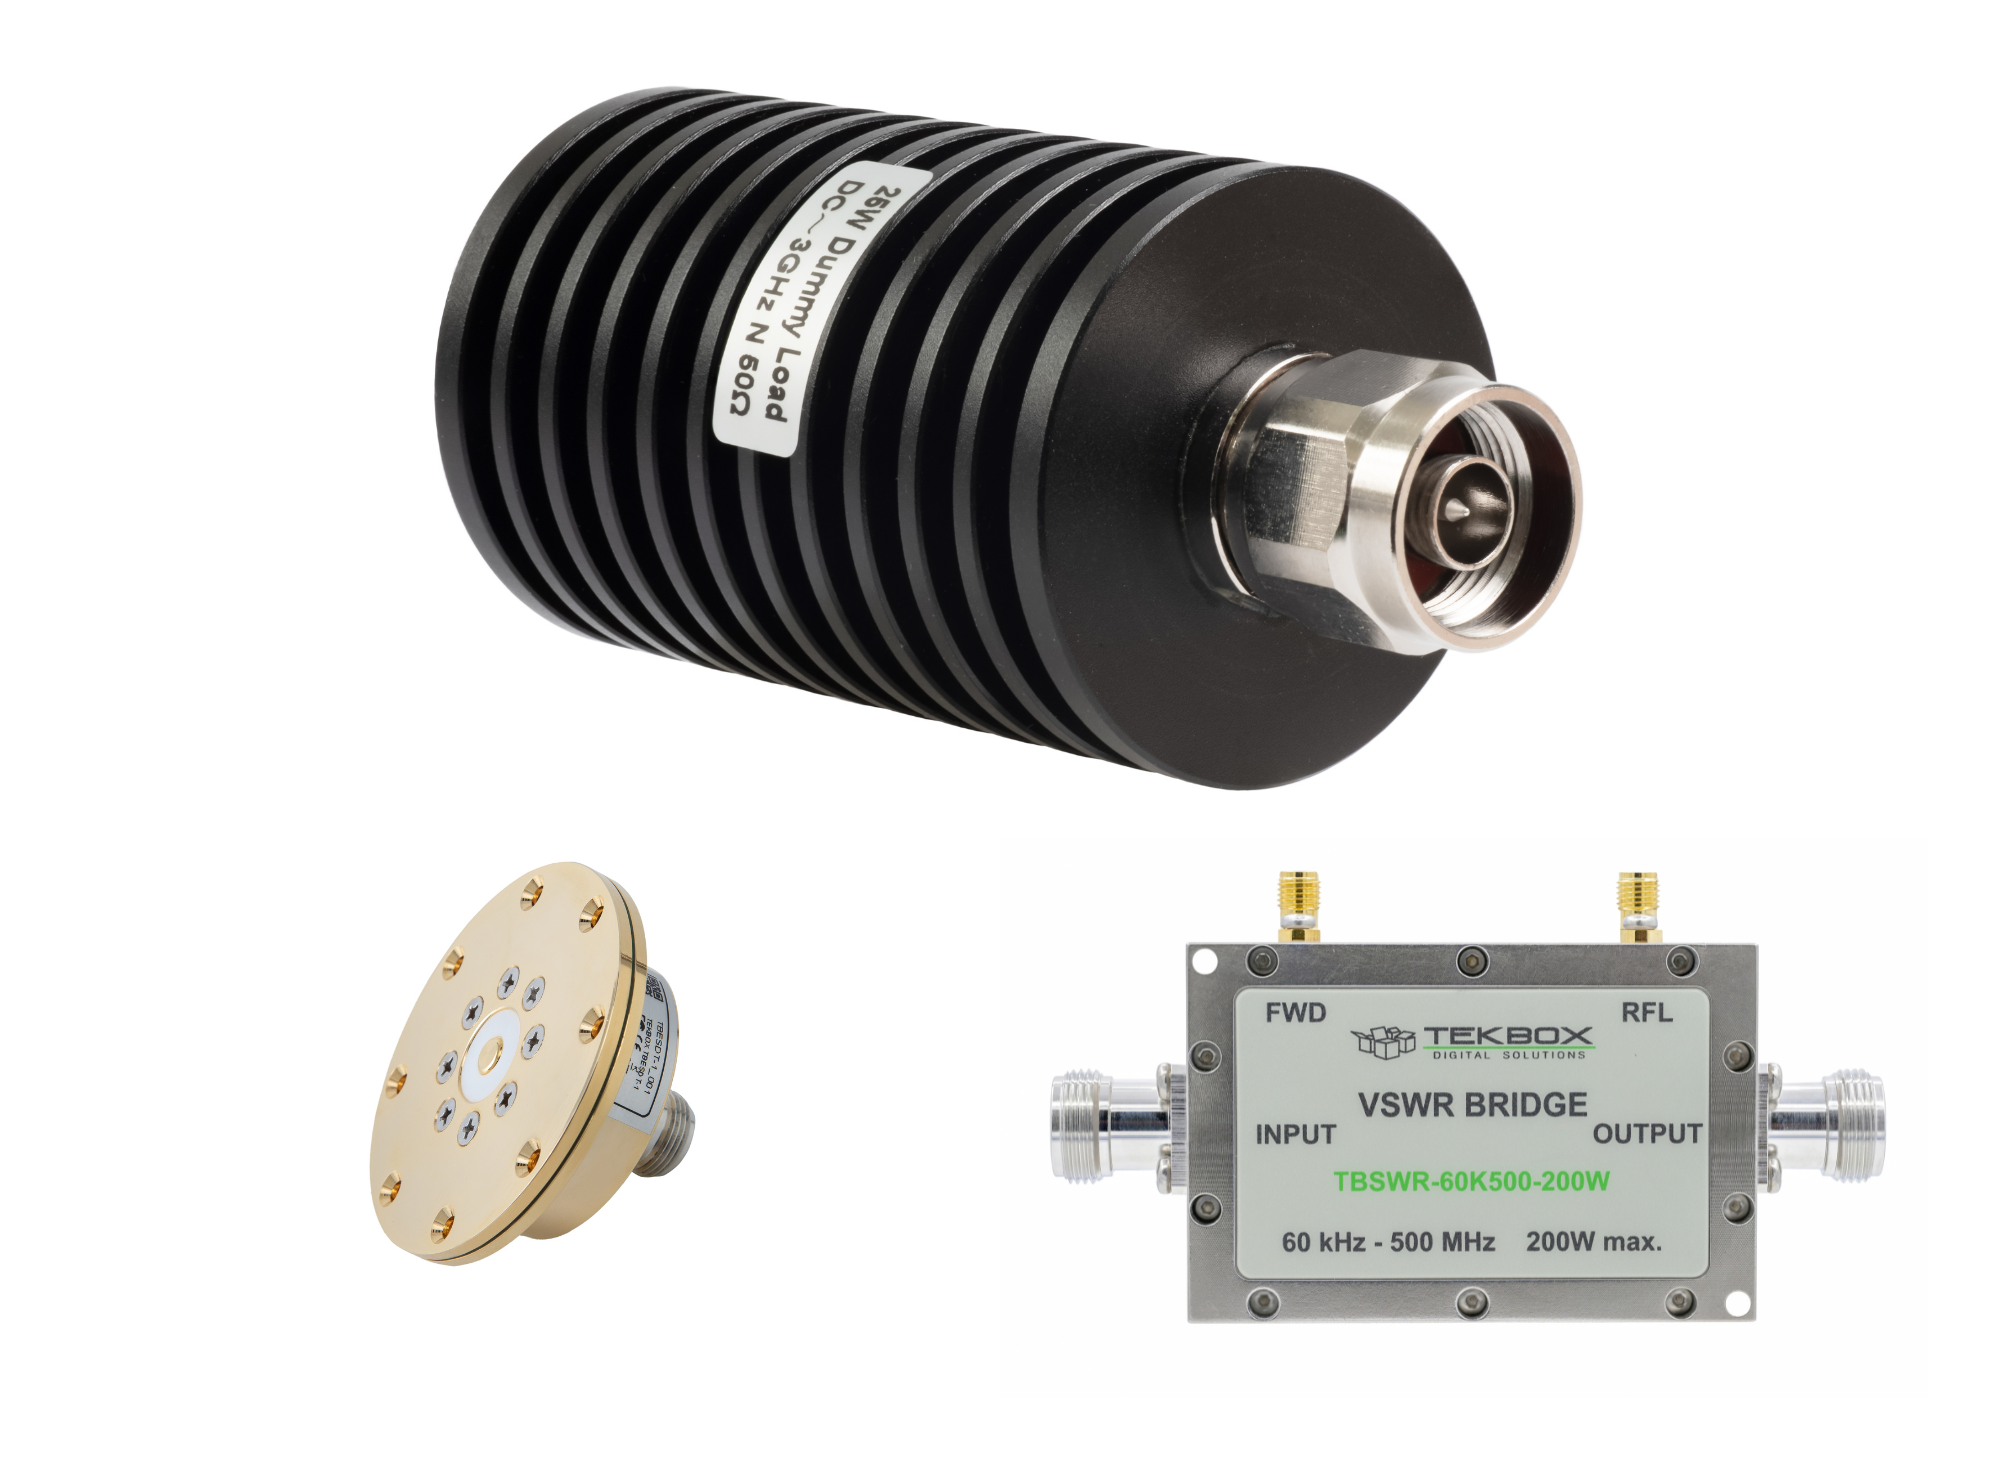
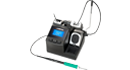
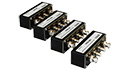
Figure 1 and 2: Near field E and H probes.

The most simple test is to configure the DSA to use the peak detector and set the RBW and Span for the area of interest per the regulatory requirements for your device. Then select the proper E or H probe for your design and scan over the surface of the design.

Probe orientation (rotation, distance) is also important to consider. The probes act as an antenna, picking up radiated emissions from seams, openings, traces, and other elements that could be emitting RF. A through scan of all of the circuit elements, connectors, knobs, openings in the case, and seams is crucial.

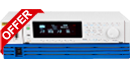
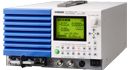
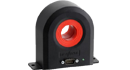
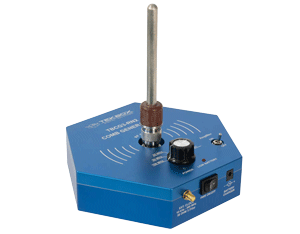
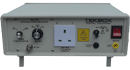
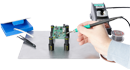
Figure 3: Using a near field H probe to test a power supply.

For the first pass, configure the spectrum analyser to use the peak detector. This will provide you with a “worst case” reading on the radiated RF and it is the quickest path to determining the problem areas. Larger probes will give you a faster scanning rate, albeit with less special resolution.

Once you have a good idea of your problem areas, you can get more detail by implementing a few common techniques. If you can, select a spectrum analyser that has the standard configuration used in full compliance testing. This includes a Quasi-Peak detector mode, EMI filter, and Resolution Bandwidth (RBW) settings that match the full test requirements specified for your product.

This type of setup will increase testing time but should be used on the problem areas. A full compliance test configuration will mean your pre-compliance testing will provide a greater degree of visibility into the EMI profile of your design.

On many instruments, you can also store cable and antenna correction factors that will allow you to see the true signal, without the added errors from the setup.

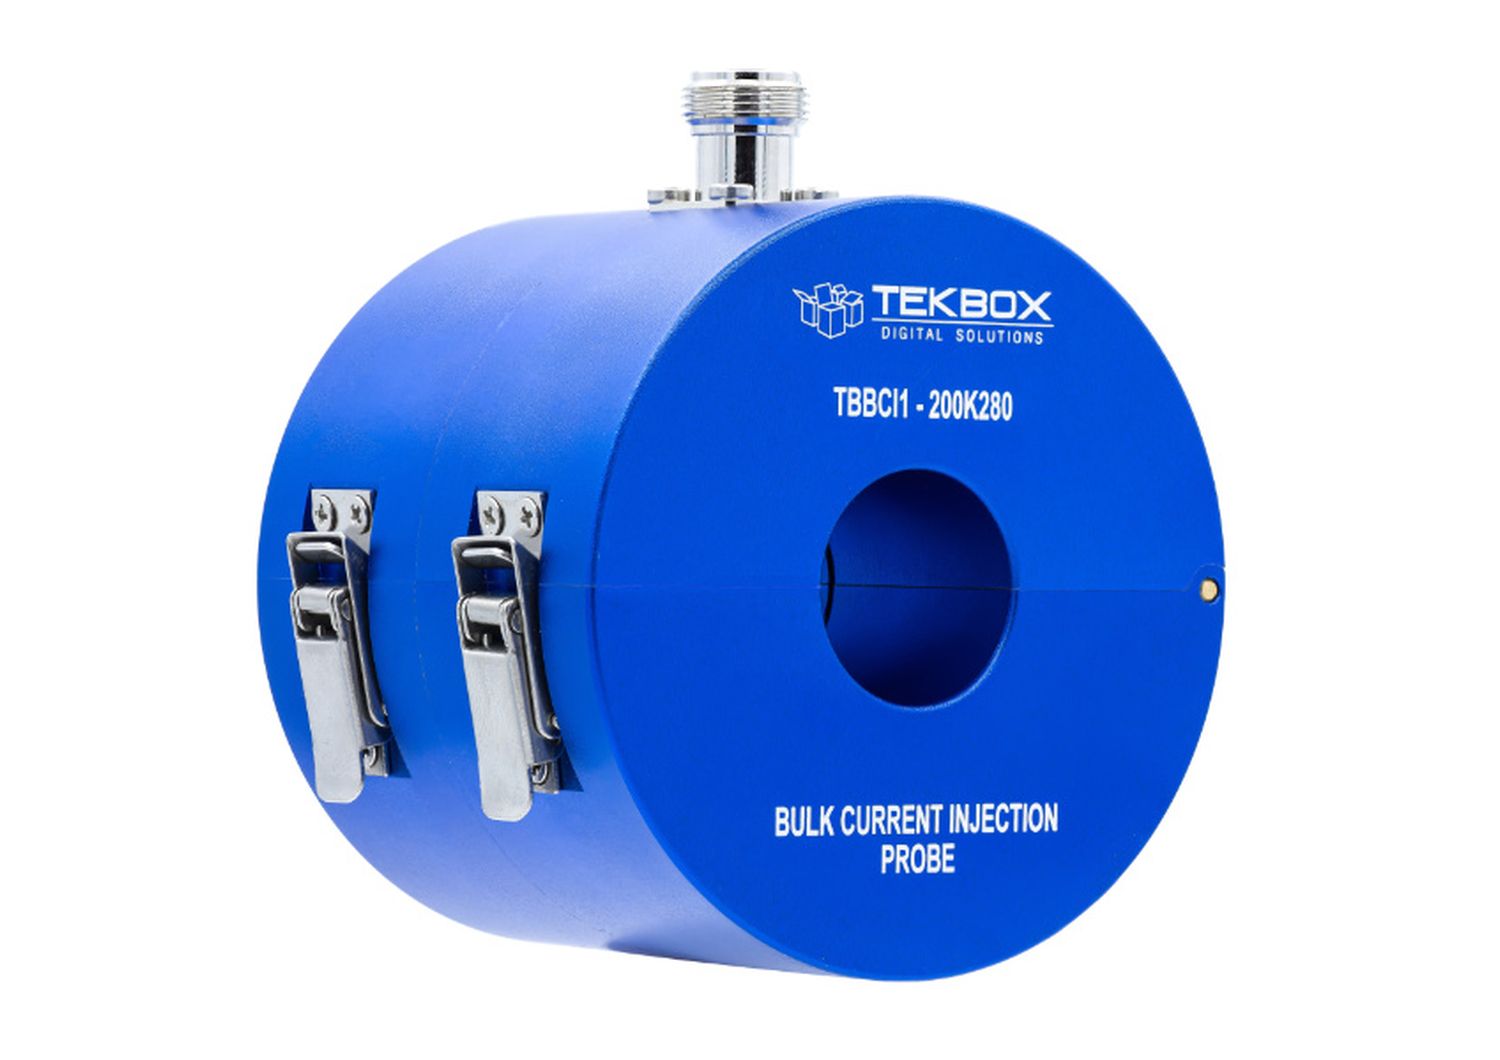
The next step in radiated testing includes using antennas in place of the near field probes, a rotating platform for the equipment under test (EUT), and can include a special room that minimises environmental factors (semi-anechoic). These setups are beyond the scope of this document, but there are references at the end that provide good references for the details of the setup.

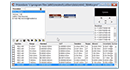
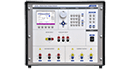
Figure 4: Compliance Setup for Radiated Emissions Testing

Measuring Conducted EMI
Conducted EMI testing requires analysing the RF energy that is coupled from the instrument or test circuit to the main power line it is connected to.

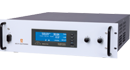
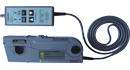
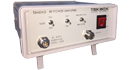
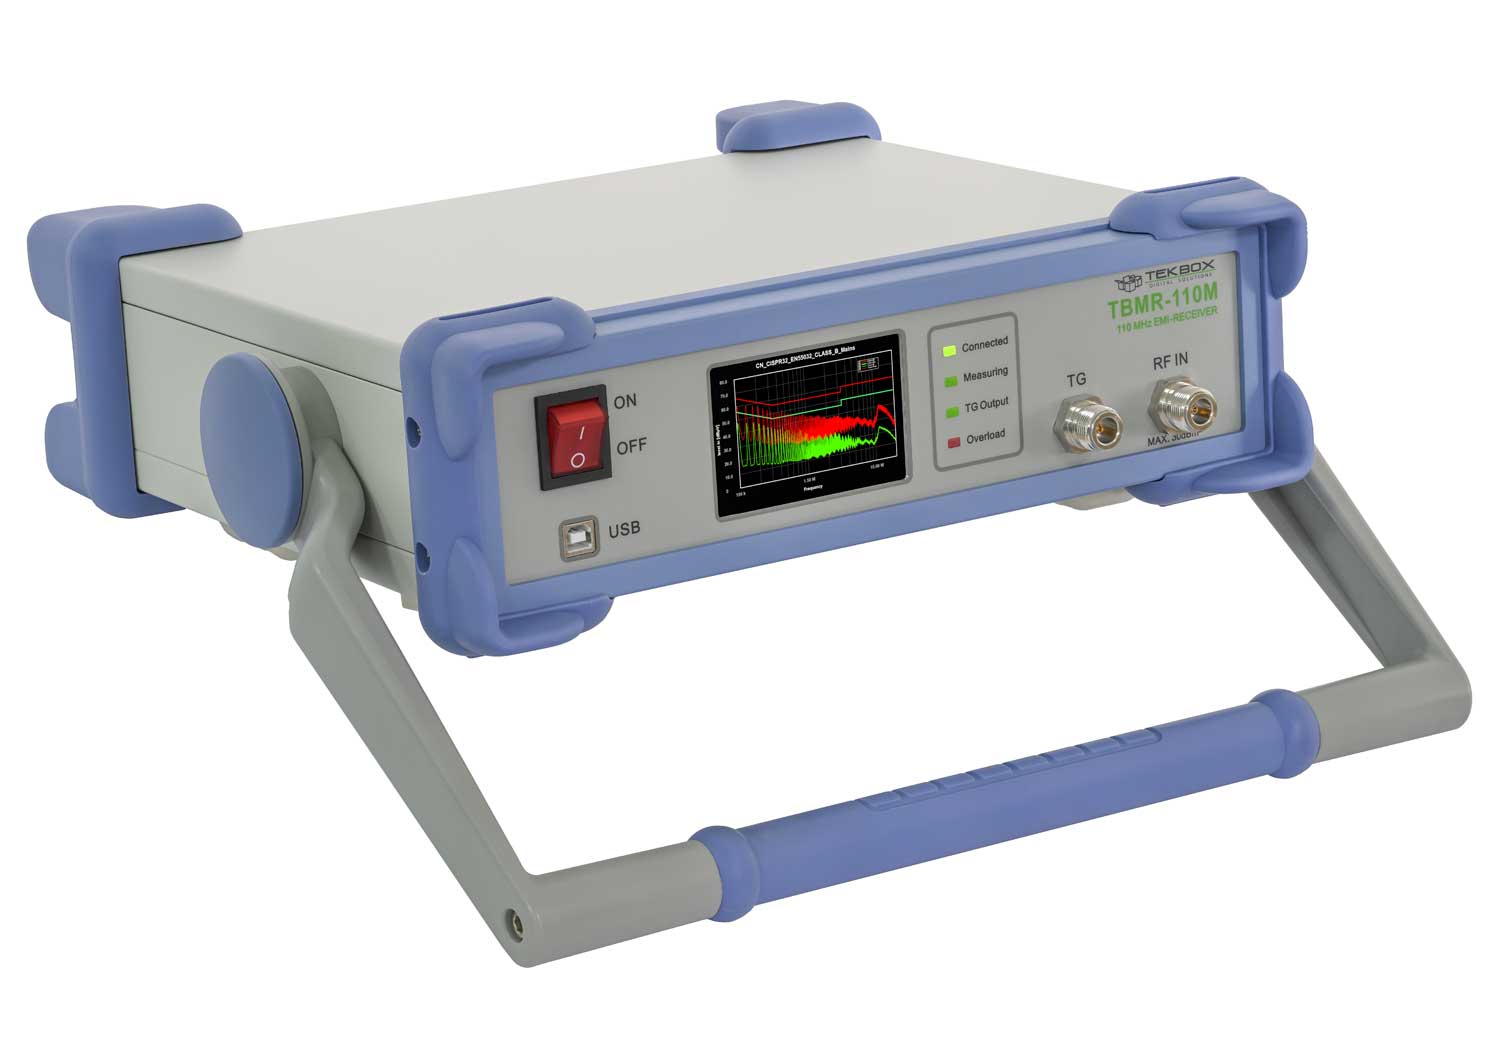
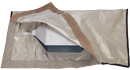
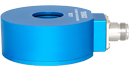
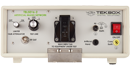
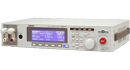
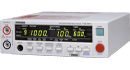
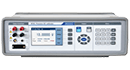
Like Radiated EMI, Conducted EMI is also measured using a spectrum analyser, but it also requires a transient limiter and a Linear Impedance Stabilisation Network (LISN). A LISN isolates the power mains from the equipment under test, isolates any noise generated by the EUT,  and couples the signals generated by the EUT to the spectrum analyser.

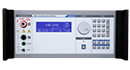
Figure 3: Standard Conducted Emissions pre-compliance setup via a transient limiter. Note: be sure to choose a limiter suited to your own system and testing regime and do your own checks first: transients can easily exceed the input rating of your analyser (e.g. at switch-on – it is good practice to avoid switching on the LISN with the analyser connected) A modern DSA’s internal level indicator is not intended to warn against fast transients and internal attenuators do not provide greater input circuit protection – if in doubt do your own measurements first to ensure you always operate within the stated input limit envelope.

As with emissions testing, the best start is a scan over the frequency range of interest using the peak detector on the spectrum analyser. Then, performing a quasi-Peak scan using the EMI filter for the problem areas. This will minimise test time while maintaining a high degree of confidence in your test.

Summary
EMC Compliance testing is mandatory for the majority of electronic products that are slated for sale throughout the world. For the cost of 1 day of compliance testing, you can have a pre-compliance setup that you can use to continually monitor and improve your design. This will help speed product development and  save the company money.

AMK: What do you get with the DSA Advanced Measurement Kit ? (DSA1000-AMK)

Posted on: December 14th, 2020 by Doug Lovell

Advanced Measurement Functions
Option DSA1000-AMK provides plenty of advanced measurement functions including T-Power (Time domain Power), ACP (Adjacent Channel Power), Chan Pwr (Channel Power), OBW (Occupied Bandwidth), EBW (Emission Bandwidth), C/N Ratio, Harmo Dist (Harmonic Distortion), TOI (Third Order Intermodulation) and Pass/Fail. The measure mode can be Single or Continuous and you can control the measurement status: Restart, Pause or Resume.

Pressing the front panel key Meas, the corresponding menu will appear on the right of the screen. Press Meas Fctn and choose a measurement function. The screen will be divided into two windows. The upper one is for basic measure, displaying sweep trace, and the lower one shows the measurement results.
1. T-Power (Time domain Power)
Enables the Zero Span Mode and calculates the power within time domain. The measurable power types are Peak, Average and RMS.

2. ACP (Adjacent Channel Power)
Measures the power of the main channel and the adjacent channels and calculates the power difference between the main and each of the adjacent channels. When enabled, both the span and resolution bandwidth of the analyser are adjusted to be smaller automatically.

3. Chan Pwr (Channel Power)

Measures the power and the power density within a specified channel bandwidth. The span and bandwidth are automatically set to smaller values in this measurement type.
4. OBW (Occupied Bandwidth)
Calculates the power within whole bandwidth by integral operation and works out the occupied bandwidth by this value based on the specified power ratio. The centre frequency difference between the measured channel and the analyser will also be given in the measurement results.
5. EBW (Emission Bandwidth)
Measures the bandwidth of the two points at both sides of the max signal when the amplitude of this max signal falls off X dB within the span range.
6. C/N Ratio
Measures the power of both the carrier and the noise within specified bandwidth and calculates their ratio.
7. Harmo Dist (Harmonic Distortion)
Measures each order harmonic power and THD (Total Harmonic Distortion) of carrier. The available range is up to 10 orders. And the fundamental wave amplitude of the carrier must be higher than -50 dBm or else the measurement will be invalid.
8. TOI (Third Order Intermodulation)
Measures the parameters of the TOI production generated by two signals which have the same amplitude and similar frequency. The measured results include the frequency and amplitude of the Base Lower, Base Upper, 3rd Order Lower and 3rd Order Upper signals, as well as the Intercept of both the 3rd Order Lower and 3rd Order Upper signals.
9. Pass/Fail
Compares the measured curve with the pre-edited, if the related rules are met, the result will be “Pass”, or else is “Fail”.

Is there an attenuator built-in on RIGOL’s DSA815?

Posted on: December 14th, 2020 by Doug Lovell

Yes, but you should still take care never to exceed the DSA815’s max input power or voltage (+20dBm or 100mW and 50VDC abs. max – pulsed waveforms can easily exceed this e.g. direct from a LISN – see below). The DSA internal attenuator function is variable to give relative 0-30dB and whilst it does not increase the permissible power, it is designed to allow the instrument to optimise its dynamic range, enabling it to measure louder signals without distortion and maintaining good accuracy.

Note: A LISN isolates the power mains from the equipment under test, isolates any noise generated by the EUT, and couples the signals generated by the EUT to the spectrum analyser.

Figure 3: Standard Conducted Emissions pre-compliance setup via a transient limiter. IMPORTANT: it is up to you to choose a limiter suited to your own system and testing regime and do your own checks first: transients can easily exceed the input rating of your analyser (e.g. at switch-on – it is generally regarded as good LISN practice to avoid switching on the LISN with any analyser connected!) A modern DSA’s internal level indicator is not intended to warn against fast transients and internal attenuators do not provide greater input circuit protection.
CONCLUSION: if in doubt do your own measurements in any test environment on a resilient instrument (such as a suitably voltage-rated fast scope) first to ensure you always operate your more sensitive instruments, such as spectrum analysers, within the stated input limit envelope.

I just received mine… how can I tell if it’s working OK?

Posted on: December 14th, 2020 by Doug Lovell

First follow the procedure for Factory Reset. Then check the noise performance is as it should be. You will need a carefully sequence of settings for this… use the quick video tip on our RIGOL pages.

How to reduce or lower noise floor? (DSA815 and DSA1030)

Posted on: December 14th, 2020 by Doug Lovell

How to reduce or lower noise floor? (DSA815 and DSA1030)
Last Updated: 01/08/2014
A simple sequence of settings will help you dig into the noise floor. With any Spectrum Analyser, setting up the (1) Span, (2) Attenuator, (3) Pre-amp and (4) Resolution Bandwidth settings – these are all important starting points to getting the best noise floor. Remember, safety first (no input or power RF nearby) and try adjusting these four settings to find out more about what to turn on, and off, to get the best from DSA815. (Like most other spectrum analysers, other settings e.g. Filter and Detector types can also affect your exact noise floor and can do so in non-linear or non-additive ways)
Remember, you don’t always want, or NEED the lowest noise floor possible for your tests because you may compromise on breadth of SPAN or you may find yourself waiting for long SWEEP TIMES so take care to decide what is best for your test-methods.
As just ONE example of the many different ways of working with spectrum analysers, if you are working with EMC Pre-Compliance, it will usually be impractical to work at noise floors this low (for most of the time anyway!) because you may be hunting for noise changes over a wide range of frequencies or spans – at least initially….
BUT you do want them sufficiently low to see how your changes are improving your emissions!
Always consult your EMC expert about the noise floor required to get reliable test results in your test environment and for your EUT. In EMC work, for example when estimating the improvements you have made to your Golden Product (the unit unchanged from your first EMC lab visit), always try to work with a noise floor low enough that you can ignore it altogether.
THE GOLDEN RULE:
Using your Golden Product, make only like-with-like tests to judge your improvement in emissions – i.e. do both these sweeps on as identical test set-ups as you can:
(i) sweep your Golden Product with DSA815 (with negligible noise floor), then
(ii) sweep your IMPROVED product (with same negligible noise floor) and compare the emissions levels of both.
Keep switching between with different settings to cover your range of concern as necessary – if your noise floors are negligible, you may be closing in on expected improvements from your next precious EMC Lab visit!
The Golden Product approach, together with some wise EMC-experienced eyes, can be powerful –
…that way, you are effectively eliminating the ever-fickle noise floor from your sums.
THE ABOVE IS NOT TO BE USED AS ADVICE FOR YOUR PARTICULAR EMC TEST REQUIREMENT – GENERAL PRODUCT INFORMATION IS ALWAYS BEST SUPPLEMENTED WITH A PROVEN, WELL-DESIGNED METHODOLOGY FROM AN EXPERIENCED EMC PRACTITIONER.

How to get the specified DANL of -135dBm? (typ, +6dB f/GHz)

Posted on: December 14th, 2020 by Doug Lovell

A simple sequence of settings will help you dig into the noise floor. With any Spectrum Analyser, setting up the (1) Span, (2) Attenuator, (3) Pre-amp and (4) Resolution Bandwidth settings – these are all important starting points to getting the best noise floor. Remember, safety first (no input or power RF nearby) and try adjusting these four settings to find out more about what to turn on, and off, to get the best from DSA815. (Like most other spectrum analysers, other settings e.g. Filter and Detector types can also affect your exact noise floor and can do so in non-linear or non-additive ways)
Remember, you don’t always want, or NEED the lowest noise floor possible for your tests because you may compromise on breadth of SPAN or you may find yourself waiting for long SWEEP TIMES so take care to decide what is best for your test-methods.
As just ONE example of the many different ways of working with spectrum analysers, if you are working with EMC Pre-Compliance, it will usually be impractical to work at noise floors this low (for most of the time anyway!) because you may be hunting for noise changes over a wide range of frequencies or spans – at least initially….
BUT you do want them sufficiently low to see how your changes are improving your emissions!
Always consult your EMC expert about the noise floor required to get reliable test results in your test environment and for your EUT. In EMC work, for example when estimating the improvements you have made to your Golden Product (the unit unchanged from your first EMC lab visit), always try to work with a noise floor low enough that you can ignore it altogether.
THE GOLDEN RULE:
Using your Golden Product, make only like-with-like tests to judge your improvement in emissions – i.e. do both these sweeps on as identical test set-ups as you can:
(i) sweep your Golden Product with DSA815 (with negligible noise floor), then
(ii) sweep your IMPROVED product (with same negligible noise floor) and compare the emissions levels of both.
Keep switching between with different settings to cover your range of concern as necessary – if your noise floors are negligible, you may be closing in on expected improvements from your next precious EMC Lab visit!
The Golden Product approach, together with some wise EMC-experienced eyes, can be powerful –
…that way, you are effectively eliminating the ever-fickle noise floor from your sums.
THE ABOVE IS NOT TO BE USED AS ADVICE FOR YOUR PARTICULAR EMC TEST REQUIREMENT – GENERAL PRODUCT INFORMATION IS ALWAYS BEST SUPPLEMENTED WITH A PROVEN, WELL-DESIGNED METHODOLOGY FROM AN EXPERIENCED EMC PRACTITIONER.

How do radio amateurs use RIGOL’s DSA815? And for what kinds of applications?

Posted on: December 14th, 2020 by Doug Lovell

Some simple examples of useful Radio Club application: An FM Broadcast Station was causing interference to our 2m to 4m transverter. This corresponded to an FM station which was recently launched. There were no problems before this Broadcast station went live: “We were able to identify all of the transverter RX output signals (wanted and spurious)” On the DSA815-TG the tracking generator can be used in zero span mode as a high quality signal source: “sweeping the FM broadcast band, and up popped a carrier on the output corresponding to 102MHz on the input, which was on an image channel of one of the two IF’s”. Rigol-UK’s customer used the DSA815-TG to find and fix the interference “we selected a Clansman band pass filter and tuned it for the 4m band using the DSA815-TG as a Spectrum analyser” These engineers were then able to tune their filter for max signal “On inserting a strong signal on 102MHz, there was no longer any spurious image signal at the output. Everyone was very impressed with the analyser and how it enabled the problem to be quickly identified and a filter to be tuned and demonstrate that the problem had gone away.”
The next step is to use the analyser to tune a coax stub filter to notch out the broadcast signal and take out the Clansman band pass filter.
In a separate test the Radio Club turned to antenna tuning to “show the response plot using a directional coupler”.

How do I check my DSA is working properly?

Posted on: December 14th, 2020 by Doug Lovell

Follow these instructions showing you how to do some quick checks on performance. You’ll know what performance to expect. They start with a handy factory reset and calibrate.

How do I add a horizontal Display Line to my DSA screen?

Posted on: December 14th, 2020 by Doug Lovell

There is a handy video reminder here showing many functions you can use on your DSA – many are under-used so don’t miss out on them check it for some useful features!