 FREE SHIPPING £75+
 CELEBRATING 50+ YEARS
 PRICE MATCH GUARANTEE


In AM schemes, the modulation index refers to the amplitude ratio of the modulating signal to the carrier signal. With the help of Fast-Fourier-Transforms (FFT), the modulation index can be obtained by measuring the sideband amplitude and the carrier amplitude. In this application note, we are going to show a convenient method of using the new Peaks/Markers function (Available on the 4 channel SIGLENT X-E scopes with firmware revisions > 6.1.31).
1. Basic Principle
Amplitude modulation uses a signal (typically a sine wave in the audio frequency range from 10 Hz to 20 kHz) to control the amplitude of a higher frequency signal called the carrier.
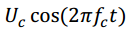
A carrier with amplitude modulation can be represented as

Where:
V(t) The Amplitude Modulated Signal
Uc Amplitude of the Carrier Signal
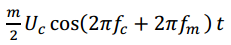
m Modulation Index
a(t) Normalized Modulation Signal
fc Carrier Frequency
Sinusoidal (commonly referred to as a “sine” wave) modulation is the most commonly used modulation waveform type. If we are using a sine wave, the modulating signal can be expressed as

According to the formulas (1) and (2), we can get

 Mathematically represents the carrier waveform.
 and
and 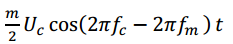 represent the positive, or upper, and negative, or lower, sidebands of the modulated signal.
The amplitude of both sidebands are 
If we set the amplitude of sideband is Us,

In logarithmic case, if the difference between the sideband amplitude and the carrier amplitude is X,

Then the amplitude modulation index can be represented as

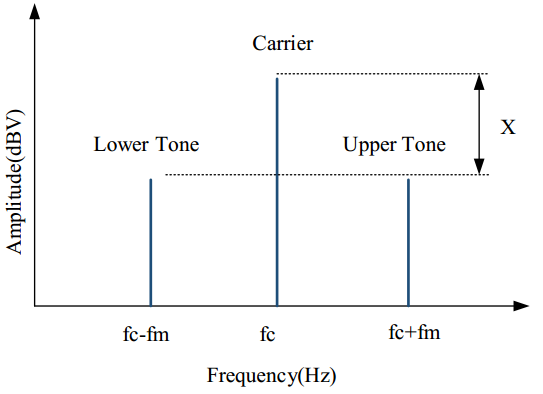
Figure 1
Here, we can see that it is easy to measure the difference between the sideband amplitude and the carrier amplitude, or X. We can then calculate the modulation index very easily.
2. Measurement Setup and Result
2.1 Equipment
Oscilloscope: Siglent SDS1204X-E with firmware version higher than 6.1.31.
Signal Source: Siglent SDG2122X
Cable: 50 ohm BNC
2.2 Instrument Configuration
In this section, we will show how to configure the instruments in order to make the measurement. For complete instructions on the FFT mode, please refer to the oscilloscope user manual and the quick start guide.
The oscilloscope is connected to the output of the signal source as shown in Figure 2.
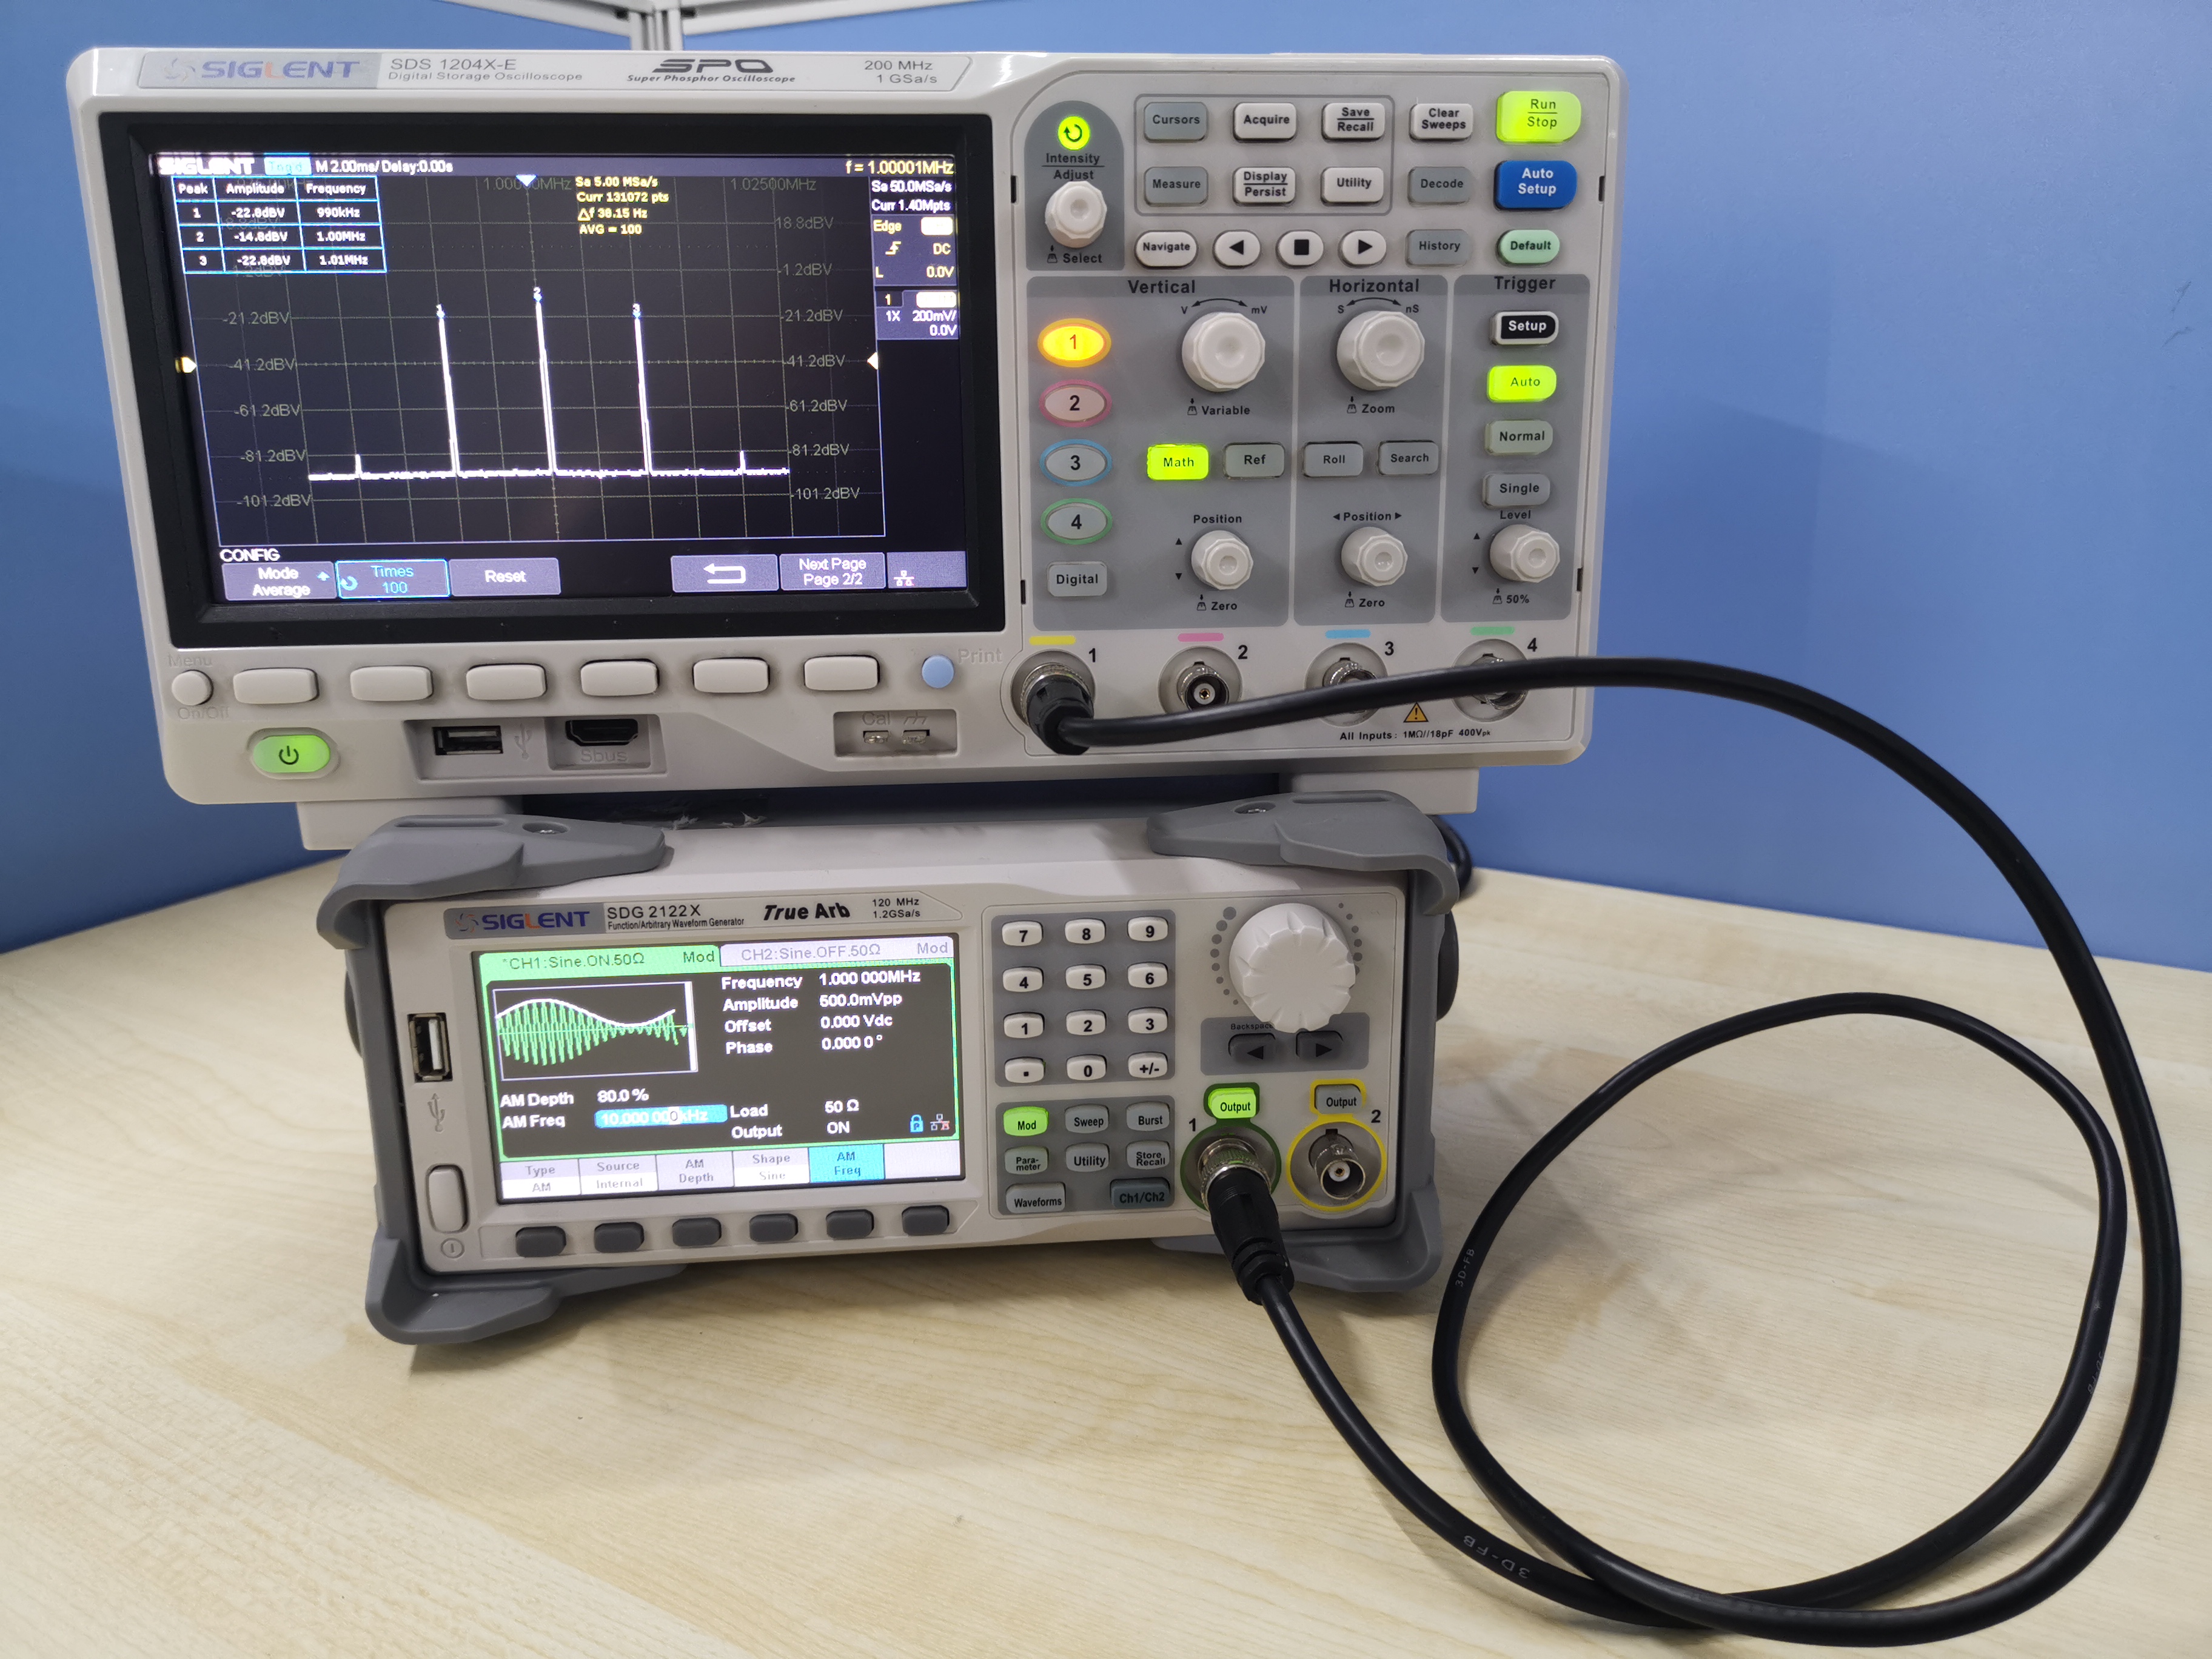
Figure 2 Set Up for the Measurement
The signal source settings are as follows:
- Mod On
- Mod Type: AM modulation
- Carrier frequency: 1 MHz
- Carrier amplitude: 500 mVpp
- Modulation frequency: 10 kHz, and the modulation index is 80%.
According to the output of the signal source, set the center frequency of the FFT plot to 1 MHz and set the horizontal scale to 5 kHz to provide a clear view of the output.
To reduce random errors, the FFT is set to average mode and the average number of times is 100. On the choice of window function, we choose flat-roofed window to obtain the optimized amplitude accuracy.
Starting with firmware revision 6.1.31, the FFT function of Siglent X-E oscilloscopes include a Peaks/Markers function and users can set the number of FFT points separately. The more points the FFT has, the better the frequency resolution of the plot will have. Note that increasing the number of points will increase the time of computation of the FFT, which will reduce the refresh speed accordingly. FFTs up to 1 Mpts at most are available on the X-E series, so we can set the storage depth to 1.4 Mpts. In this application, there is no need for a high sampling rate, since that will lead to a large delta frequency. Set the timebase to 2ms.
According to the input signal, we can deduce that a frame waveform has 28 k-cycles and we will use the first 20 k-cycles to do the FFT operations. For decent resolution, there should be at least five sample points in a cycle, so the minimum number of FFT points should be at least 100 kpts. 128 kpts is suitable, since under the premise of satisfying the measurement conditions, we can get the results faster.
The new version also supports Peaks/Marker, it can quickly identify and label peaks. We choose Peaks to make the measurement.
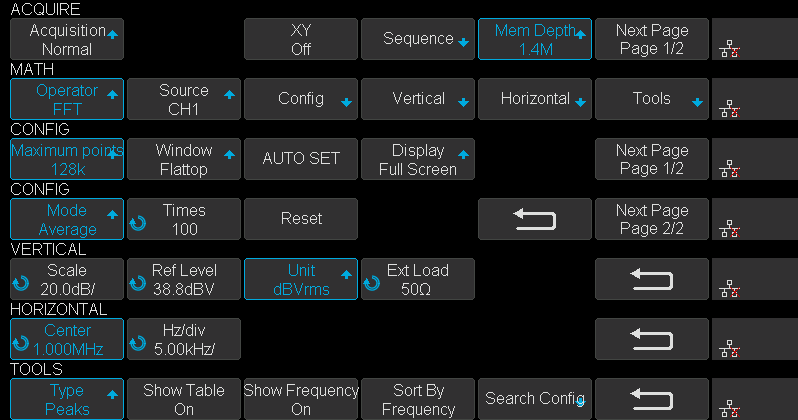
Figure 3 Configuration Screens
The configuration process is as follows:
First, set timebase to 2ms and enter the ACQUIRE menu, set Mem Depth to 1.4M. Second enter the MATH menu, set Operator to FFT, enter the CONFIG menu, setMaximum points to 128k, set Window to Flattop, set Display to Exclusive then go to the next page, set Mode to Average, set Times to 100. Third enter the VERTICALmenu, set Unit to dBVrms, then enter HORIZONTAL menu, set Center to 1MHz, set Hz/div to 5 kHz. Last, enter the FFT TOOLS menu and set Type to Peaks, turn on theShow Table switch to show the peaks list and turn on the Show Frequency switch to show the frequency of peaks, set Sort By to Frequency.
2.3 Result
After configuration is done, enter SEARCH menu, adjust Threshold to show several peaks for easy reading from the table then press Reset. After the average number increasing to 100, the FFT result as shown in Figure 4.
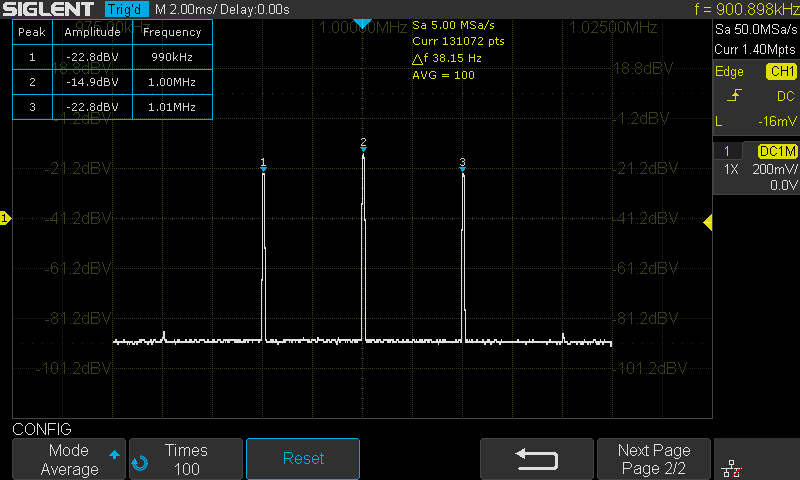
Figure 4 FFT Peaks Result
The carrier amplitude is -14.9dBV, the sideband amplitude is -22.8dBV. So the difference between the sideband amplitude and the carrier amplitude is -7.9dB.
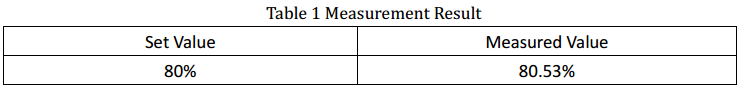
According to the previous introduction, the results of the modulation index are shown in the table 1.
Table 1 Measurement Result
3. Summary
The Siglent oscilloscope with newly released Peaks/Markers software, supports peak and harmonic searching which provides a convenient method of spectrum analysis.