 FREE SHIPPING £75+
 CELEBRATING 50+ YEARS
 PRICE MATCH GUARANTEE


Spectrum analysers like the SIGLENT SSA3000X Series have a number of available detector selections that can help you observe specific signals of interest. This operating tip provides a brief description of the available detector types and suggested usage.
BASICS:
The SIGLENT SSA 3000X Series spectrum analysers normally display power versus frequency on a Cartesian coordinate system as shown below:
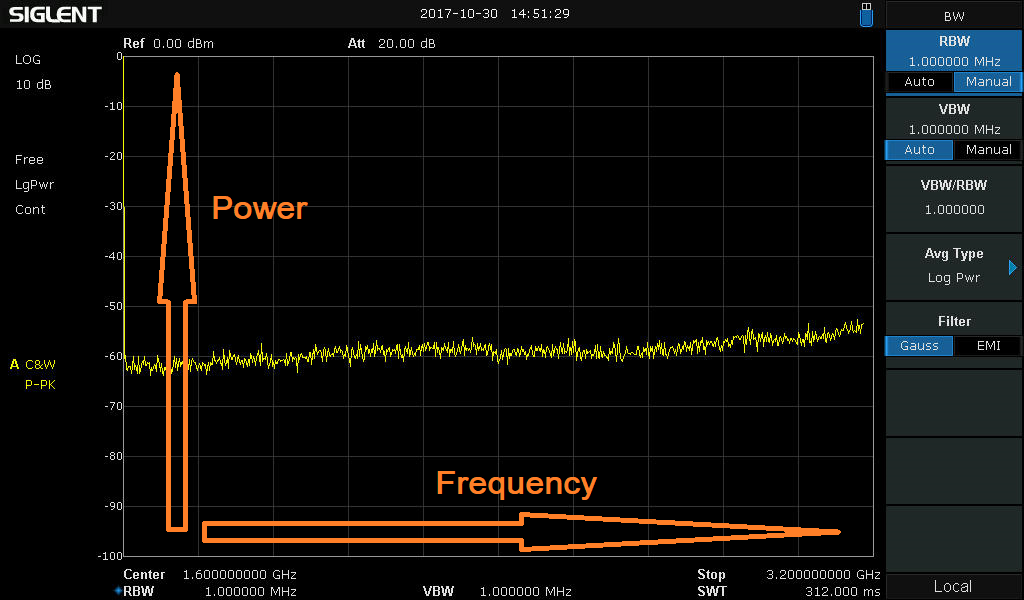
The horizontal span (which composes a frequency span when the instrument is configured to sweep/not in zero span mode) is comprised of 751 discrete samples (also called “bins”).
The analyser sweeps from the start frequency to the stop frequency and fills each frequency “bin” with an amplitude value determined by the detector selected for that particular sweep operation.
THE DETECTORS:
Positive Peak: For each trace point, a Positive Peak detector displays the maximum value of data sampled within the corresponding time interval.
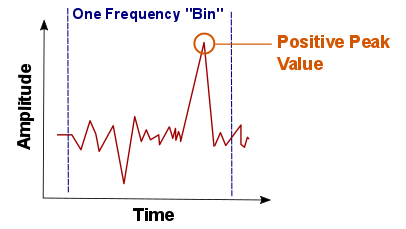
Positive peak detectors are the most commonly used detector type. They are perfect for measuring the peak power of a signal as well as determining the “worst case” signal in EMI applications.
- Negative Peak: For each trace point, a Negative Peak detector displays the minimum value of data sampled within the corresponding time interval.
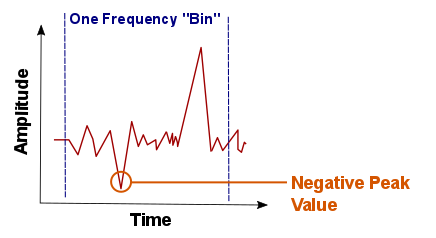
Negative peak detectors are rarely used, but can be helpful when comparing positive and negative peak values when looking for CW and Pulsed signals. CW signals will have less difference between positive and negative peak values for a given frequency bin. A pulsed signal could have a significant difference
- Sample: For each trace point, a Sample detector displays the transient level corresponding to the central time point of the corresponding time interval.
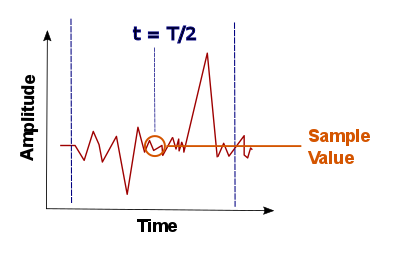
This detector type is applicable to noise, noise-like signals, or small amplitude continuous wave (CW) signals that are near the noise floor of the analyser.
- Normal: Normal detector (also called rosenfell detector) displays the maximum value and the minimum value of the sample data segment in turn; namely for an odd-numbered data point (bin), the maximum value (positive peak) is displayed; for an even-numbered data point (bin), the minimum value is displayed. In this way, the amplitude variation range of the signal is clearly shown.
- Average: For each trace point, an Average detector displays the average value of data sampled within the corresponding time interval.
- Quasi-Peak (QP): This is a mathematically weighted form of the positive peak detector. For a single frequency point, the detector measures the peaks within the defined detector dwell time. These peaks are then weighted using a mathematical model that simulates a tank circuit that meets charge/discharge rates specified by CISPR (an international organization that governs electromagnetic effects). The measurement time for QPD is far longer than Peak Detector.
For a given signal, the QP detector values will never be greater than the positive peak results.