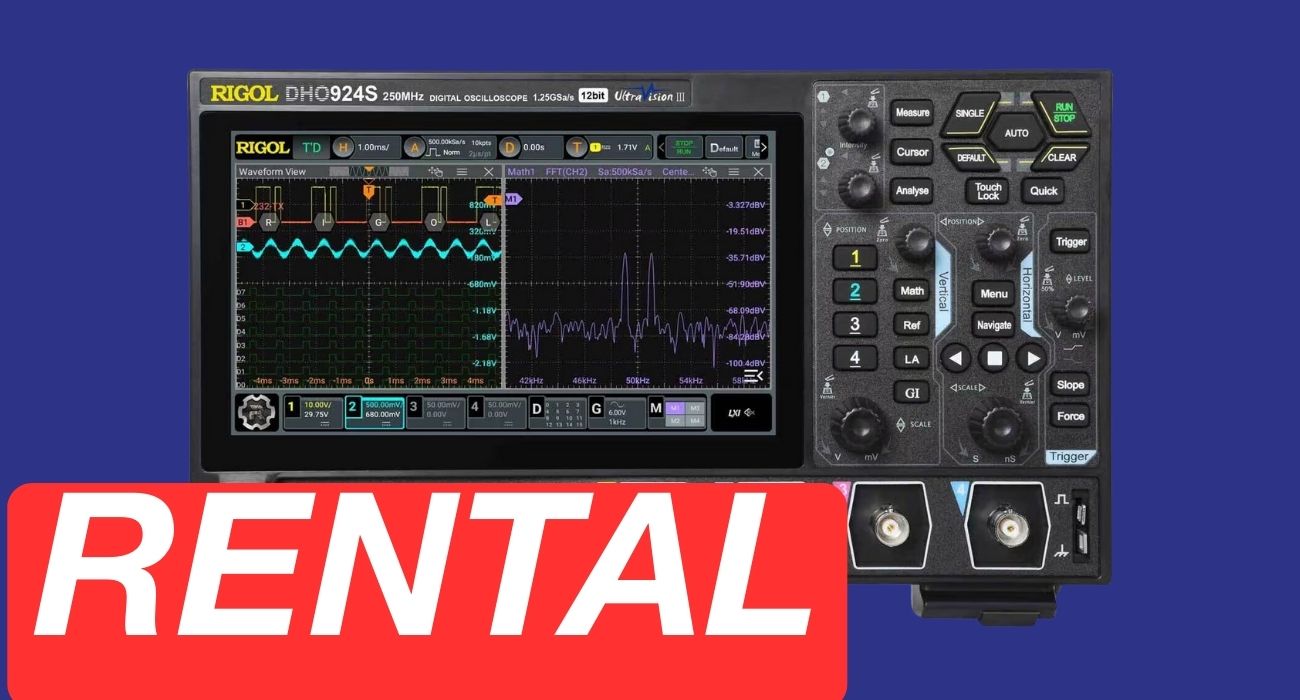
Protocol Analysis allows you to quickly decode serial communication. The oscilloscope is capable of triggering on and decoding parallel, RS232, I2C, SPI, LIN, CAN, FlexRay, I2S, and 1553B.
For the example below I am decoding an I2C signal but the other protocols follow a similar set up.
- With my probes connected to the clock line and the data line of the signal I first need to set up the signals trigger. To do this press the “Menu” button in the triggering section on the front panel of the instrument. This is the right most “Menu” button.
- Next I changed the trigger type so that it is listing the correct decode type.
- With the Trigger type now set to I2C I now configure the SCL and SDA lines so that they are corresponding with the correct channel on the instrument.
- With the instrument now triggering on the I2C signal I can now enter the instruments decode menu. To do this press decode.
- Once in the decode menu press “Copy Trig” and then switch “Bus Status” to “ON”. You will start to see the instrument decoding the signal and displaying this in the middle of the display.
- Currently the signal is being decoded in a hex format, but this can easily be changed to either decode hex, binary, decinormal or ASCII. To do this press “Display” and then press “Format” and change it to “ASCII”.
- In the “Display” menu there are several different settings first you can change the decode format, then you can move the position of the decoded line, then there is the ability to label the signal and then finally the event table.
- Press “Event Table” and then turn ON the “Event Table”. At this point it will be displayed in the middle of the screen.
- Change the format of the event table to ASCII by pressing “Format” and then select “ASC”.
- Change the view to payload, to do this press “View” and then select “Payload”. Here you will see the decoded signal being displayed in a matrix which this is a great way to view a serial signal all at once to quickly allow you to see if there is a problem with the serial signal.
- Next change “View” to “Packets”. In this view you can scroll on the menu to view all of the data packets, in this case “RIGOL” you can see the time that it was sent in relationship to the trigger point, weather it is a read or write packet then address of the packet, the data and then if it was acknowledged.
- Another useful aspect of the event table is the jump to capability. First press “SINGLE” then select the “6th“ packet by pressing on it. Notice that there are two dotted lines both above and below that packet and then press “Jump to”. This will cause the instrument to automatically move the 6th packet into the middle of the display so that you can zoom in on it.
- Exit out of the event table by pressing the “X” in the upper righthand corner of the window and then change the horizontal scaling to be 100 us by rotating the “Horizontal Scale” knob clock wise.
































 FREE SHIPPING £75+
 CELEBRATING 50+ YEARS
 PRICE MATCH GUARANTEE

