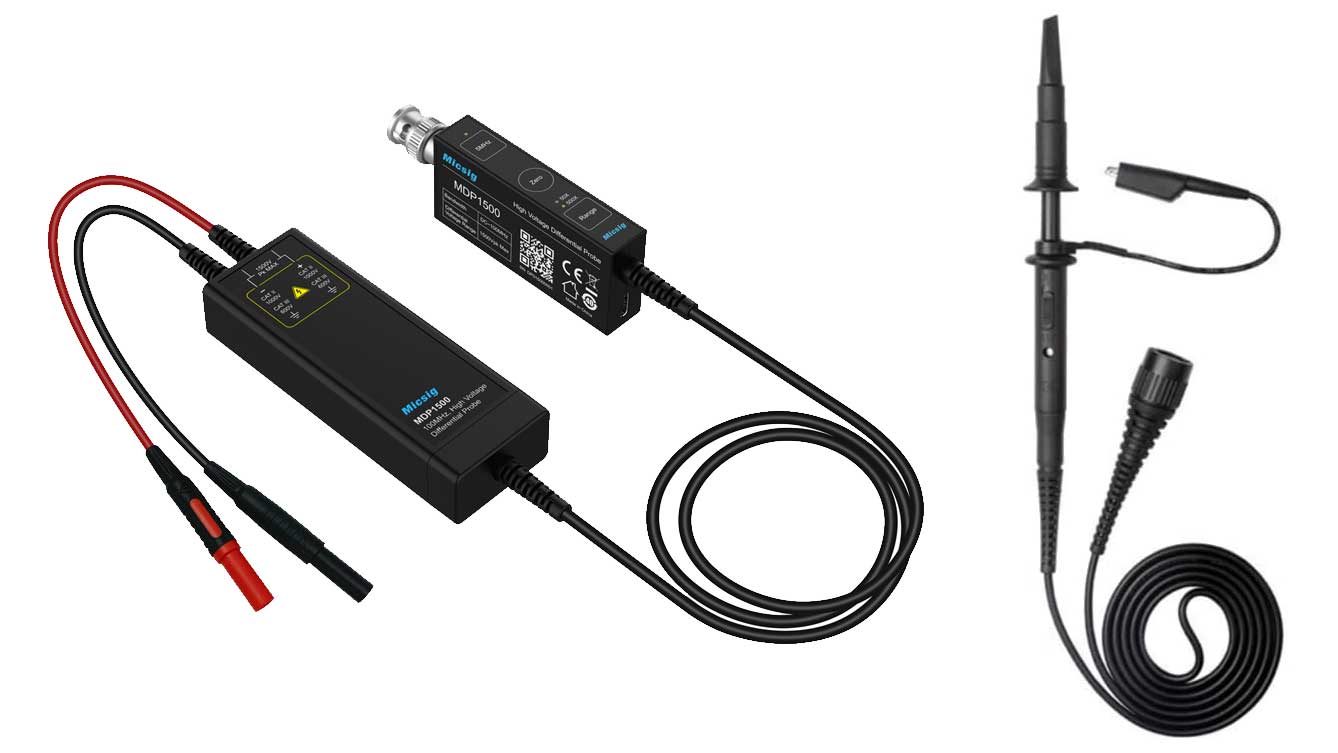
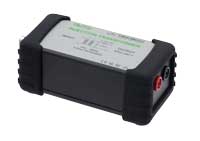
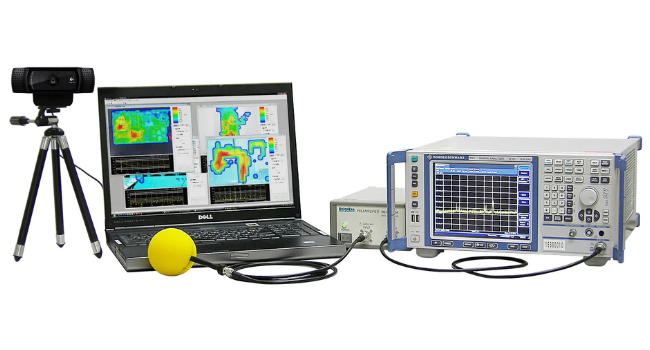
When using a differential probe with a real time spectrum analyser you will be using the instrument in General Purpose mode and then you will need to create a reference signal that can be referenced when using the differential probe to compare the two signals, then once the reference has been created next you will then use the build in trace math feature to compare the reference signal that was created to the currently measured signal, this will create the actual differential signal.
First create a reference trace – to do this you will need to connect the Vout+ to the positive end of the differential probe and then the negative end of the differential probe to ground. Once these have been connected set the spectrum analysers frequency span to equal the differential probe’s span, for the RP1100D it is 9kHz to 100MHz and for the RP1050D it is 9kHz to 50MHz. With the span set now turn on the spectrum analysers reference amplitude in the amplitude menu to 0 dBm, this may need to be changed depending on the signal.
With the spectrum analyser configured set the differential probe to X100 and then configure the amplifier so that it is producing a single tone at 9 kHz with an amplitude set to the amplifiers maximum output. Then enter the trace/p/f menu on the spectrum analyser, select the 2nd trace and then set the trace type to max hold and then begin to sweep across the frequency range with the amplifier. Use as small of steps as possible between the frequency points as this will make the reference more accurate. Now that you have created a reference signal freeze this signal, to do this now change the trace type to freeze in the trace/p/f menu. You will then have a reference signal similar to the one pictured below.
(Reference signal is pictured in blue)
Next use the trace math function to create the actual measured differential signal – Next leave Vout+ connected to the positive probe and then connect the negative probe to Vout-. Then use the spectrum analyser’s trace math feature to the compare the reference trace on trace 2 to the real time differential trace on trace 1. For this test I have terminated Vout+ and Vout- to a 50-ohm load, after the probe connection. This will create the green signal shown below.
(Note that I do not have Vout+ or Vout- currently turn on in the image. Reference trace in blue, math comparison and differential signal in green.)
In order to confirm the results, I have set both Vout+ and Vout- to output a 50 MHz sine wave with 0dBm of amplitude and they are shown below to have the same amplitude resulting in a math signal with an amplitude of 0 dBm. Shown below.
(Reference trace in blue, math comparison and differential signal in green.)
To take amplitude measurements use the marker function – To measure the amplitude use the marker function with the marker trace set to math. Below shows the reference signal with Vout+ with an amplitude of -10dBm and Vout- with an amplitude of 0 dBm and shown below is the difference in amplitude. Due to how it is calculated the amplitude is half of the difference which in terms of dB is roughly -3.5 dBm.
(Reference trace in blue, math comparison and differential signal in green.)
 FREE SHIPPING £75+
 CELEBRATING 50+ YEARS
 PRICE MATCH GUARANTEE
Home / Knowledge Base / Knowledge Base Spectrum Analysers / Knowledge Base RSA5000 Series / How to take differential measurements on a RSA5000
How to take differential measurements on a RSA5000
Posted on: December 16th, 2020 by Doug Lovell


