Rohde & Schwarz NPA701-G 100 kHz, 50 µW – 12 kW Compliance Tester, Power Analyser

£3504.00 (£4204.80 inc. VAT)

Description


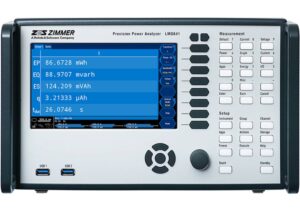
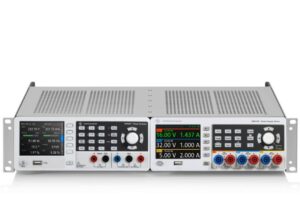
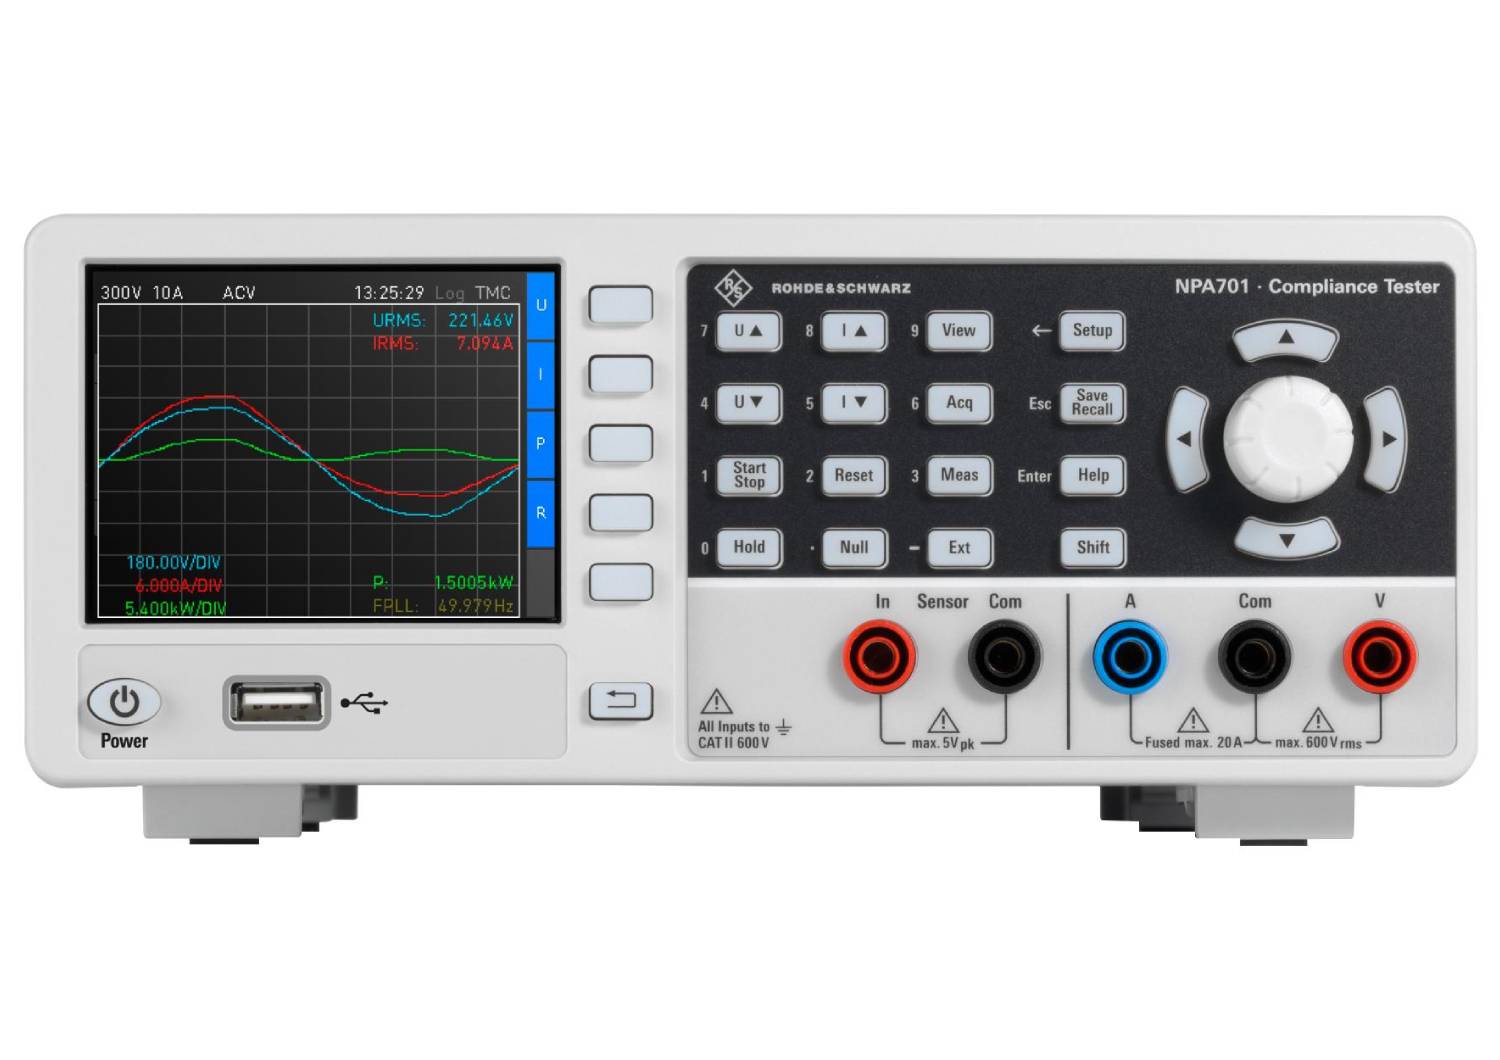
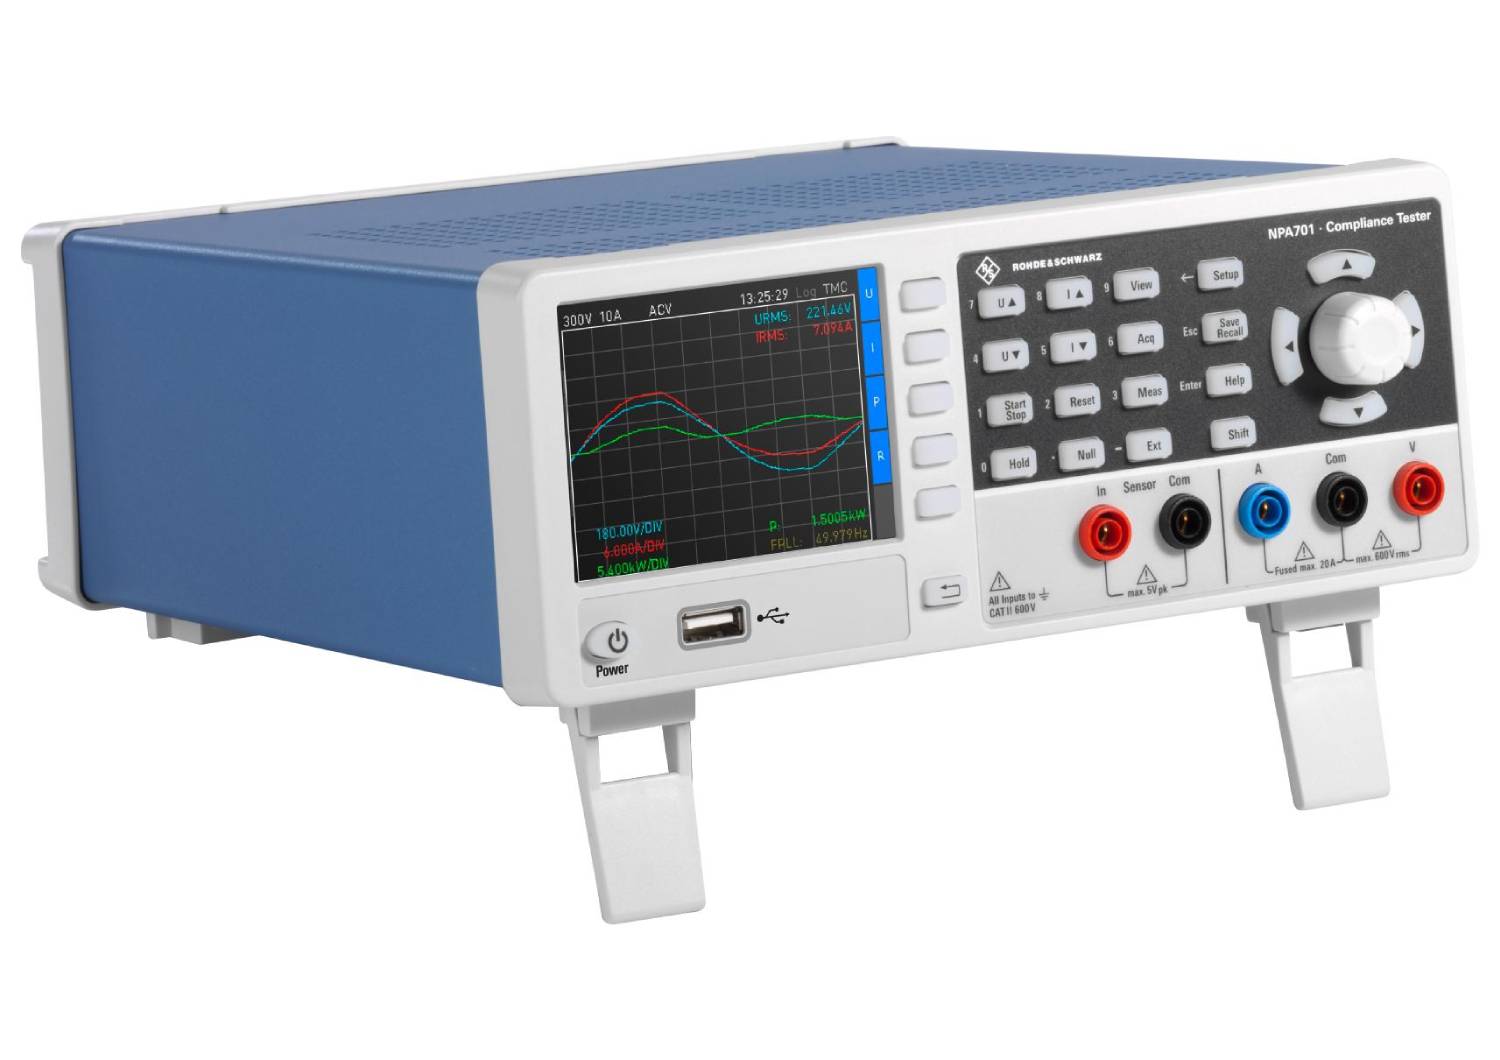
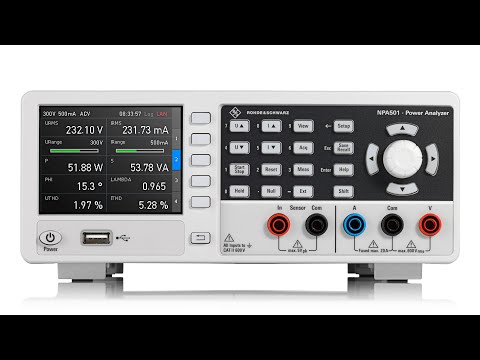
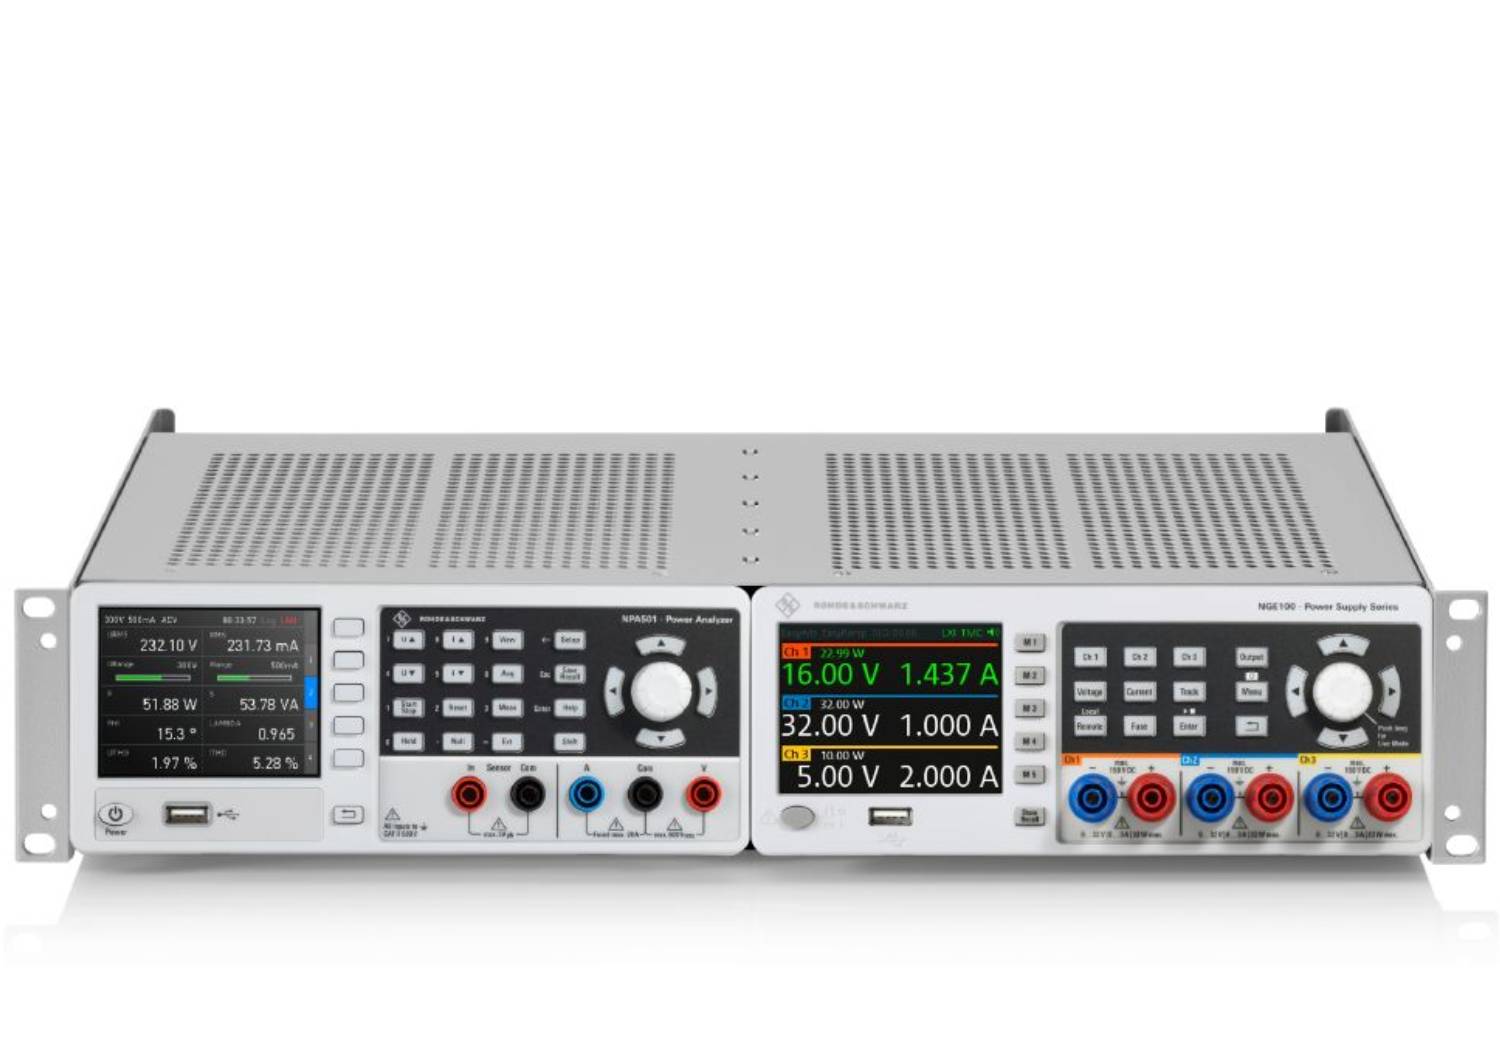
Rohde & Schwarz NPA701-G Power Analyser & Compliance Tester (With IEEE-488 (GPIB) interface)

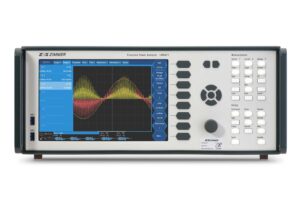
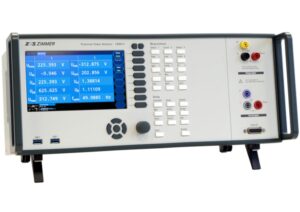
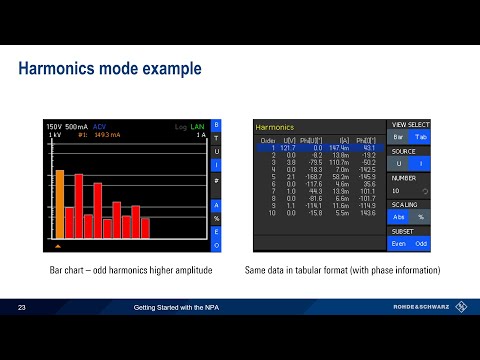
In harmonic analysis, the R&S®NPA701-G power analyser graphically displays up to the 50th harmonic in a logarithmic amplitude scale. The user‑configurable, dual‑channel trend chart function for U, I, P, S, Q and F is unique in this class of instruments. The brilliant QVGA colour display (320 × 240 pixels) simultaneously displays up to 10 user‑configurable measurement results with a refresh rate of 10 measurements per second. The instrument has a basic accuracy of 0.05%. Signals are acquired from DC to 100 kHz at a sampling rate of 500 ksample/s. Current and voltage are displayed with 16-bit resolution. The logging function lets users store measured data with a timestamp in CSV format for a nearly unlimited period of time. Screen content can also be saved to a USB flash drive anytime at the push of a button. A PASS/FAIL function lets users monitor numerous measurement results.

The instrument has wizards for the IEC62301 (standby), EN50564 (extended standby) and EN61000-3-2 (harmonic current for EMC, CE approval) standards, enabling autonomous measurements without a PC.

Key Features
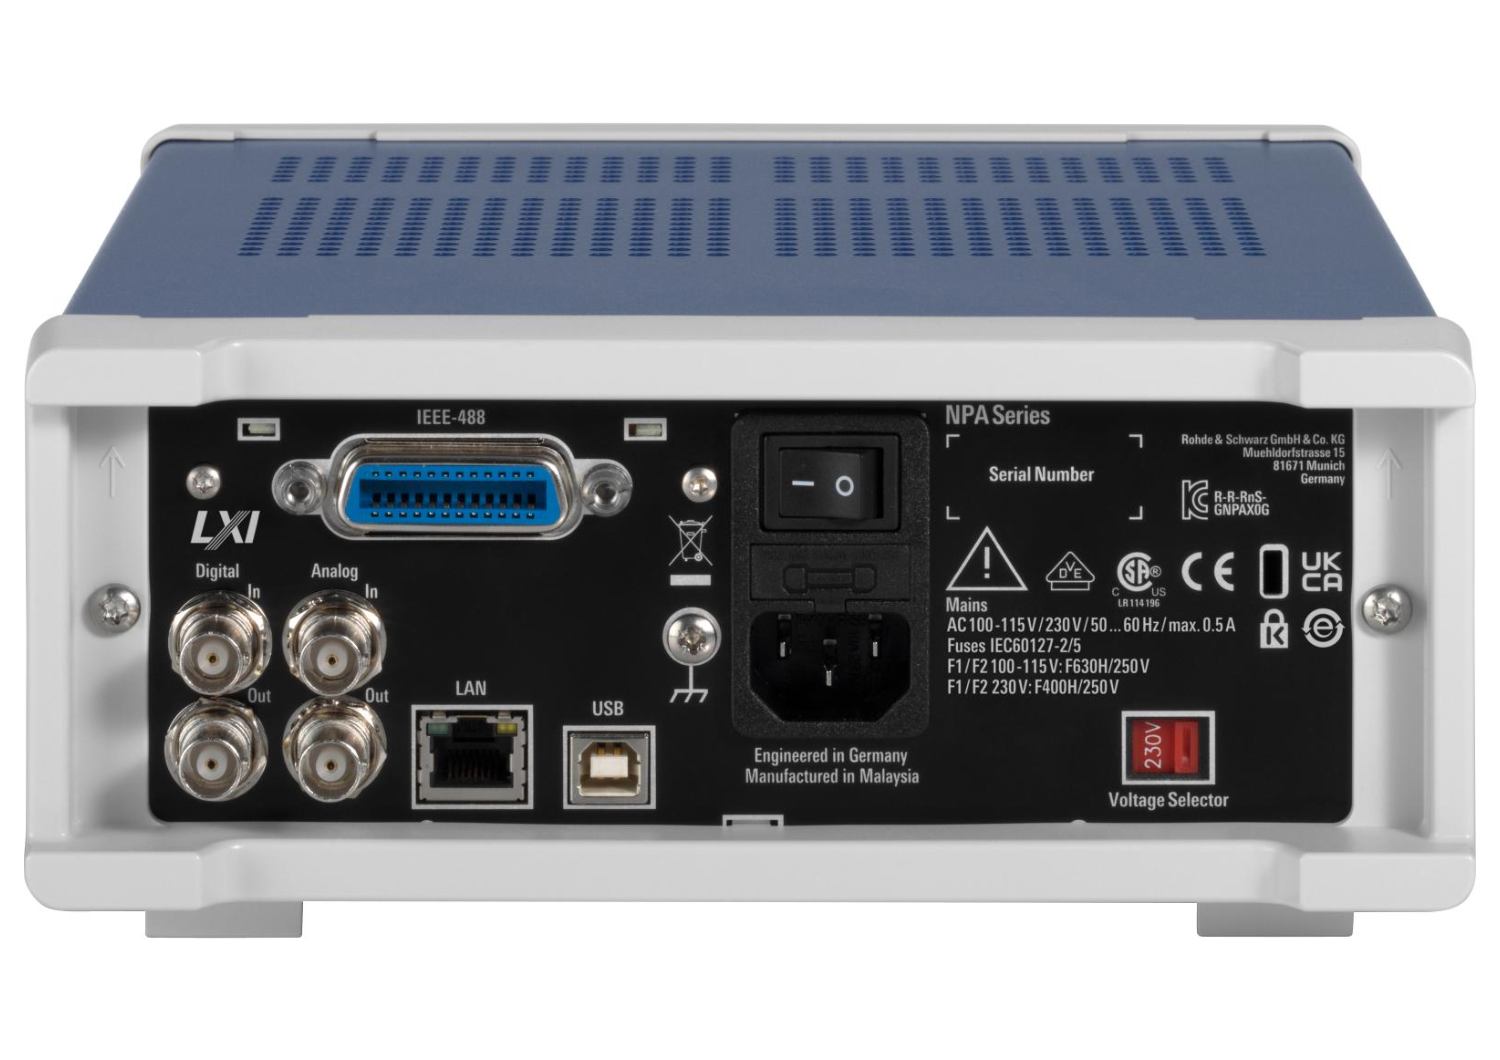
  • Additionally has an IEEE-488 (GPIB) interface
  • Power measurement range: 50 µW to 12 kW
  • Analogue bandwidth: DC to 100 kHz
  • Sampling rate: 500 kSa/s
  • 16-bit resolution for current and voltage
  • Basic accuracy: 0.05%
  • Voltage: 600V | Current: 20 A
Ports & Remote Control
  • Front: 4 mm safety sockets
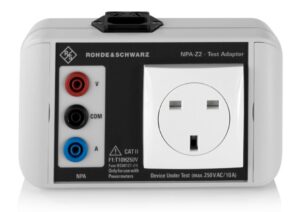
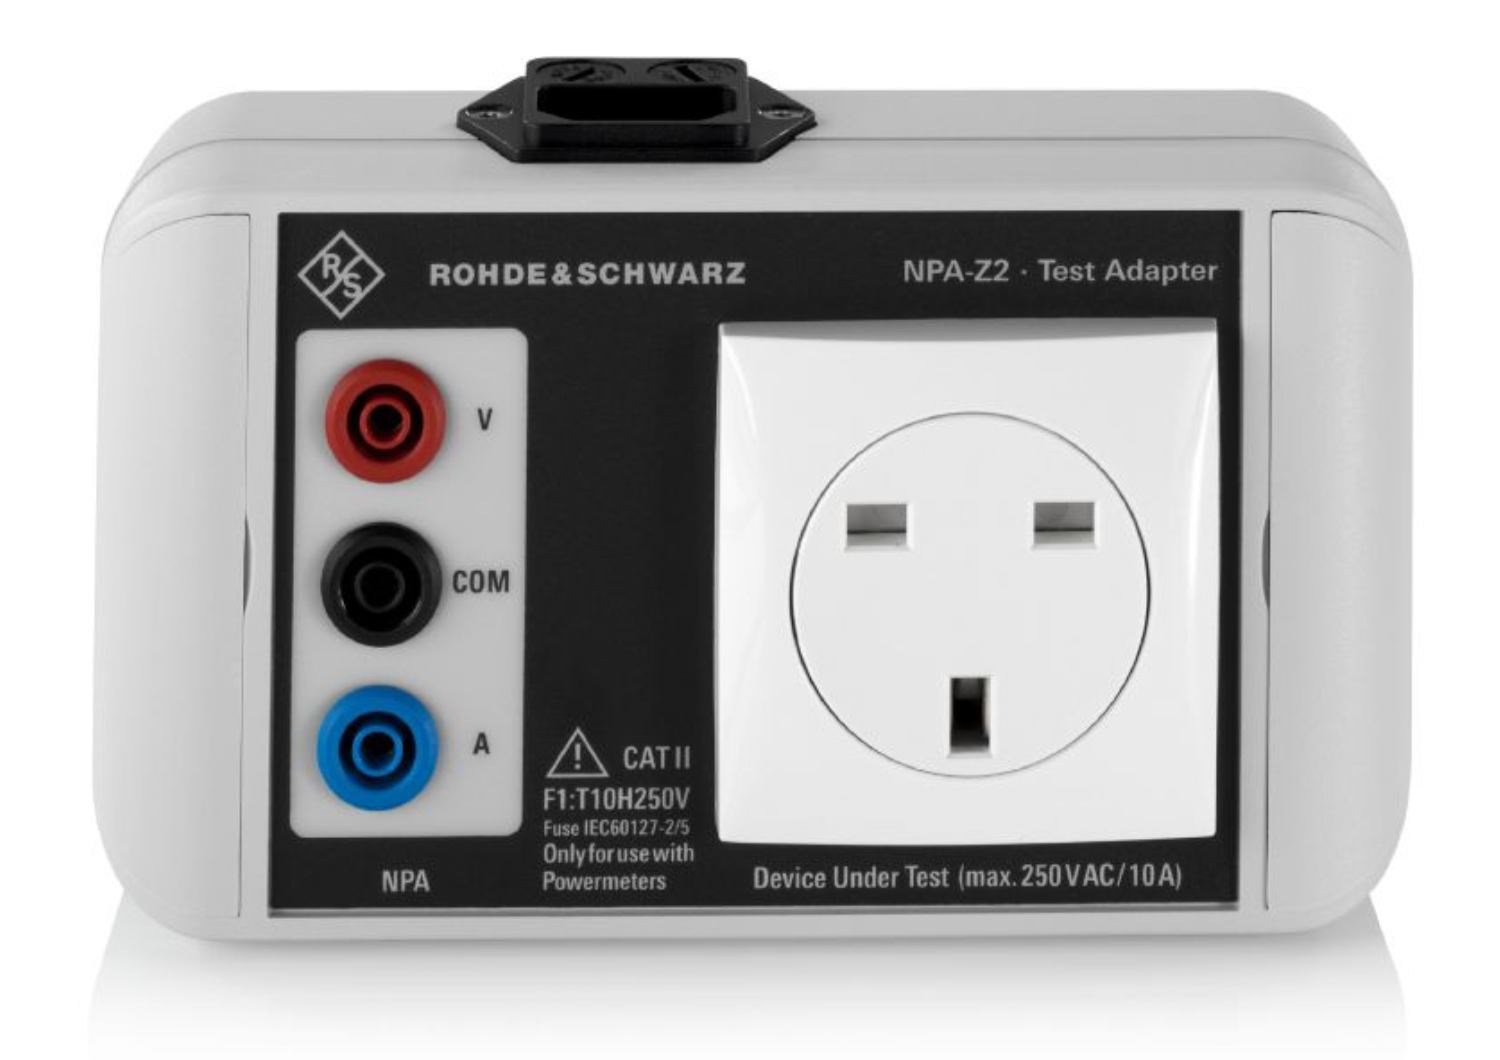
  • Country-specific test adapters as accessories
  • USB port (virtual COM port, TMC)
  • Ethernet interface (LAN) with integrated web server
  • Remote control via SCPI-based commands
  • Driver packages for LabVIEW, LabWindows/CVI, IVI.net
Measurement Functions
  • Genuine consumption meter thanks to a hardware‑based integrator
  • Up to 26 different measurement and mathematical functions
  • Brilliant QVGA colour display (320 × 240 pixels)
  • Simultaneous display of up to 10 numerical measurement functions
  • User‑configurable measurement display
  • Graphical display modes for inrush, harmonic analysis, waveform and trend chart
  • Limit testing with PASS/FAIL indication for up to 6 limits selectable from 14 measurands (e.g. U, I, P, S, Q, F)
  • Rear: 4 BNC ports for analogue and digital inputs and outputs
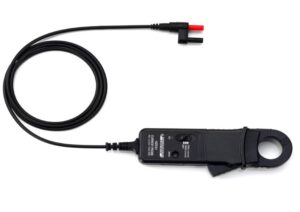
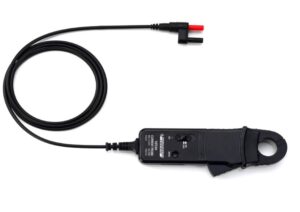
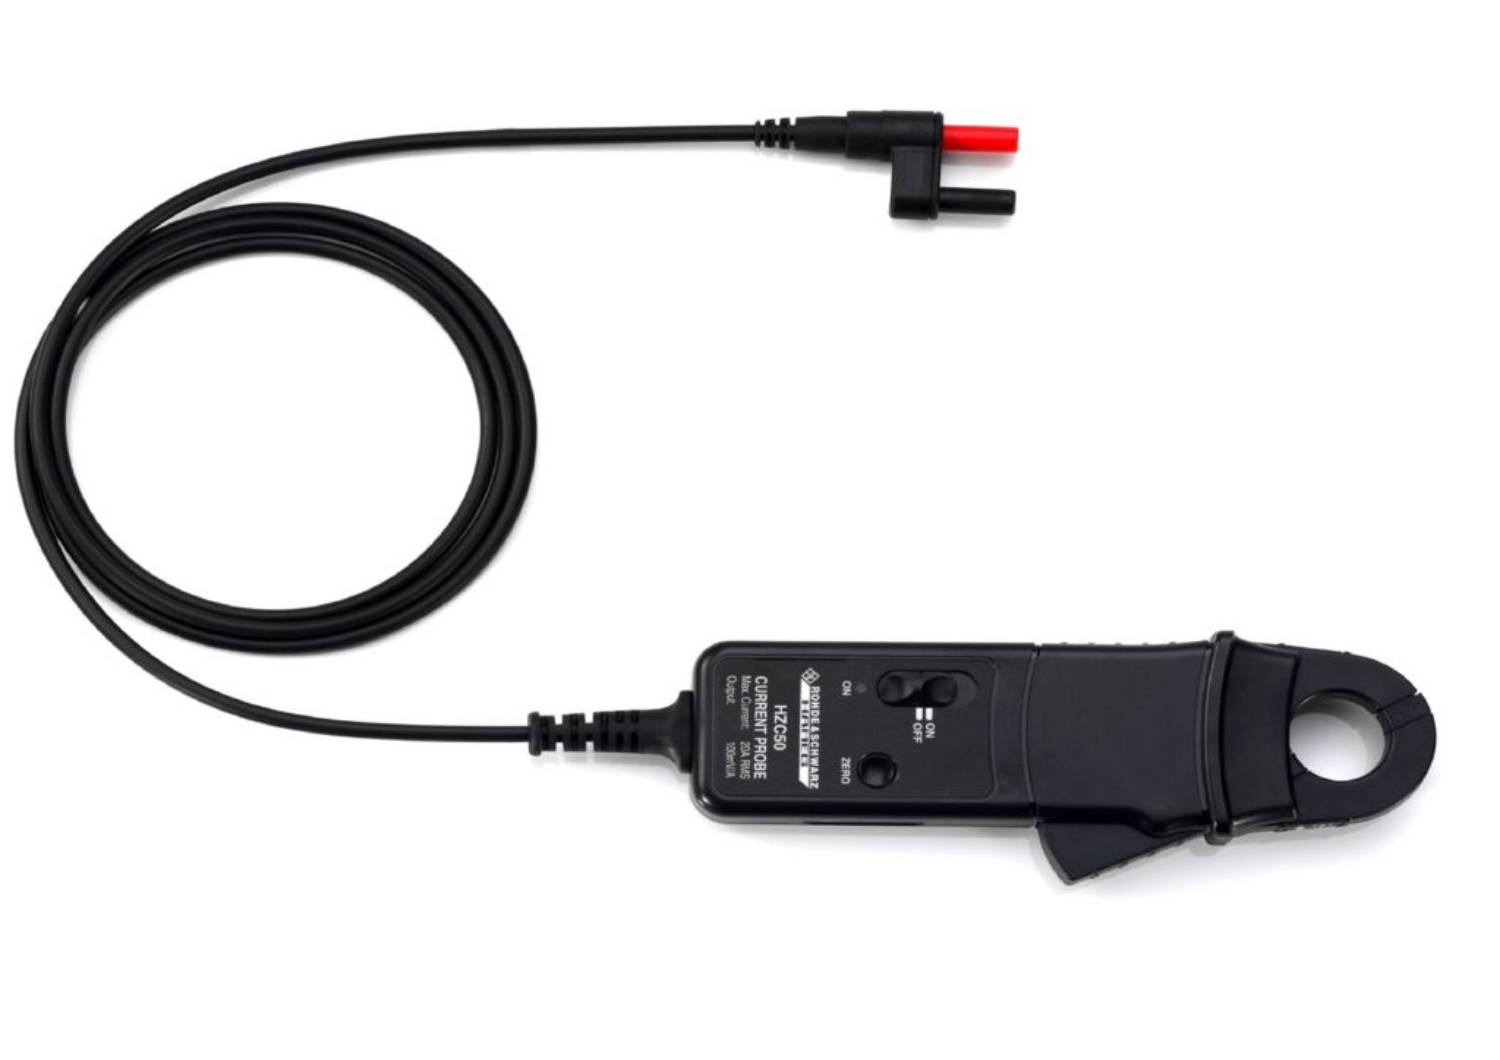
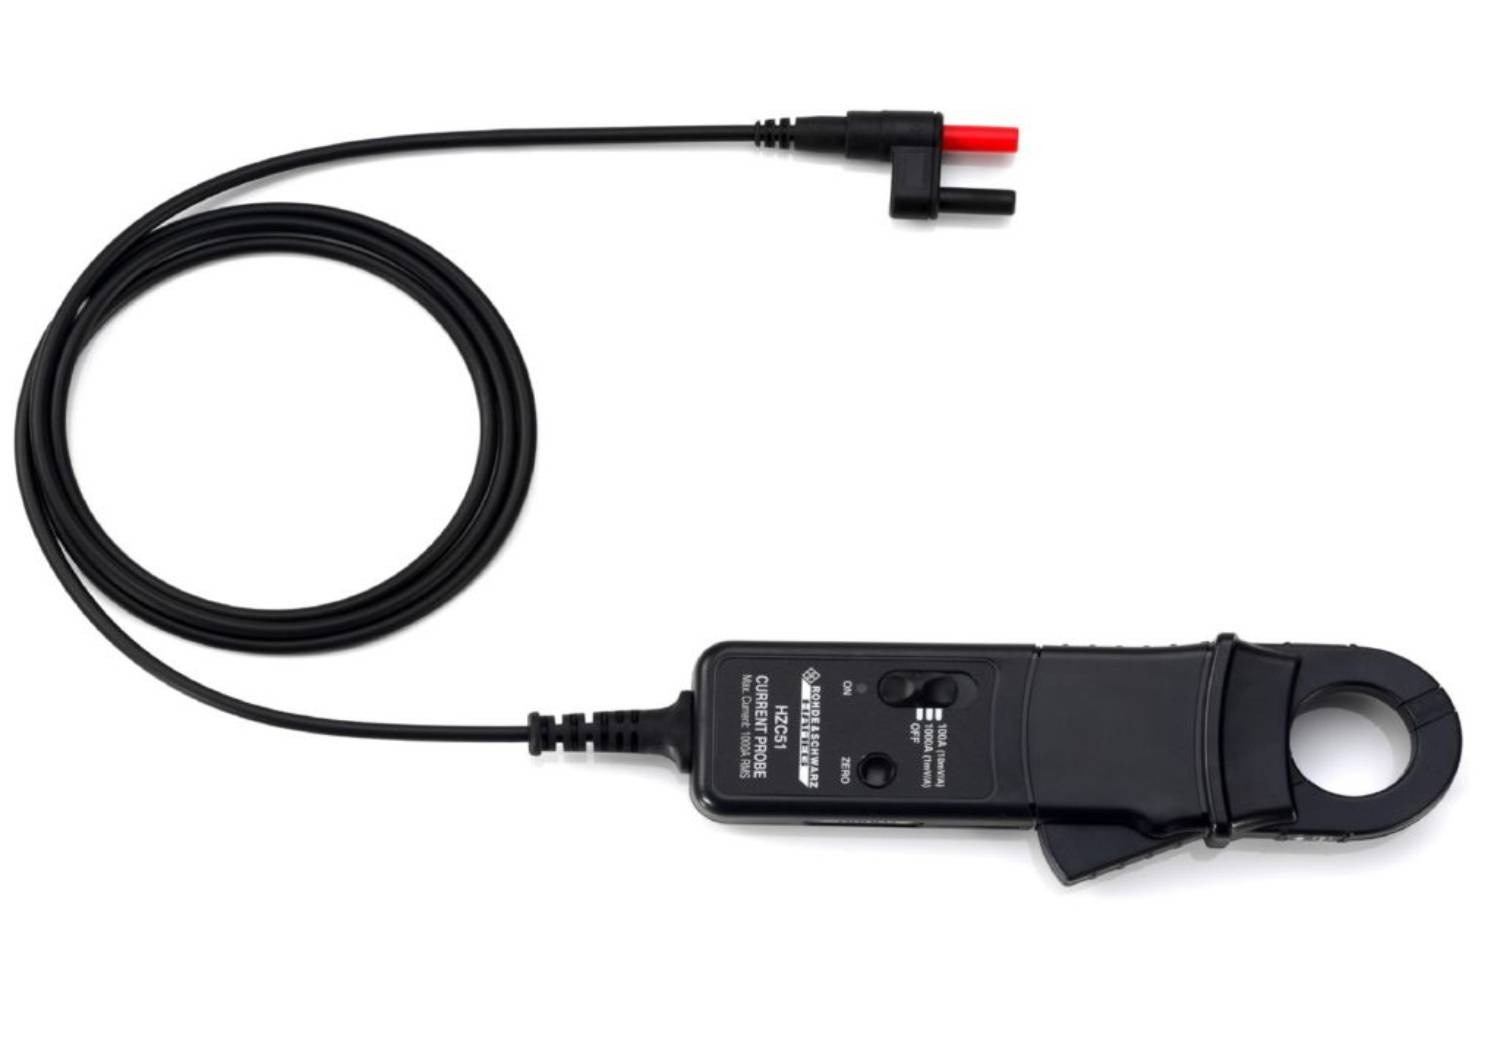
  • Sensor input for a current probe or shunt
  • R&S®NPA701 only: compliance test for key standby and harmonic standards
Applications
  • Pre-Compliance Testing: Verifying products meet international energy standards before official lab certification.
  • Quality Assurance: Standardised, repeatable testing of consumer electronics for global markets.
  • EMC Verification: Checking current harmonics to ensure CE approval compliance.

Product Images

All tests conducted with our compliance testers adhere strictly to the following standards:

  • IEC62301: standby power consumption

  • EN50564: standby power consumption

  • EN61000-3-2: harmonic currents for EMC, CE approval


A user-friendly step-by-step wizard helps throughout the measurement process by automatically configuring the necessary instrument parameters. This approach minimizes potential measurement errors and ensures quick access to results. No prior familiarity with the aforementioned standards is required. Upon completion of testing, the system generates verification reports, eliminating the need for an external PC
Harmonic mode enables the computing of root mean square (RMS) values and phase angles for harmonics. The accompanying bar chart elegantly visualizes patterns for up to 50 voltage and/or current harmonics, while the tabular presentation has comprehensive insights into magnitude and phase values per harmonic. Users can also selectively display odd or even harmonics. The intuitive interface allows seamless navigation through the data, with cursors or a rotary knob so that users can focus on individual harmonics, highlighted in a distinctive yellow.
Includes a BNC sensor input for external current probes/shunts and rear-panel BNC ports for analogue/digital I/O.
This graphical mode can plot up to two measured variables against time, similar to the roll mode in oscilloscopes. Primarily used observing longer time periods, it can accommodate 40 seconds to 80 minutes of data on the display. Decide on the plotting variables and adjust the time base, while the vertical trace scaling is done automatically. When operating, the numerical representations of maximum and minimum values are visible on the screen for enhanced analysis
Utilize a graphical representation to depict occurrences such as fast switch-on operation. This approach simplifies comprehension and helps compare the switching on and the steady-state operations of a device. The system can continuously record 8192 samples with durations of 16 milliseconds to 67 seconds. After a trigger event (similar to a single-shot capture on an oscilloscope), voltage and/or current are graphically plotted.
This function helps create a graphical representation of voltage, current, and/or power across a single waveform period, similar to the display format on an oscilloscope. The period is automatically determined by the R&S®NPA power analyser . An automatic hardware trigger initiates each acquisition and the waveform is continuously refreshed. Alongside waveform visualisation, the R&S®NPA furnishes numerical outputs for RMS voltage, RMS current and power, with softkeys for selecting displayed or concealed traces
The integrator function serves a special purpose in unstable power measurements. The function is designed to compute and present the cumulative DUT power or energy consumption across a designated time span in both the active and standby states. Users can flexibly select their preferred acquisition mode, choosing between manual, time-based or event-based options. All R&S®NPA models deliver results in various formats, including positive, negative, and total watt-hours, with continuous updates in real time.

Product Videos

Documentation

Electrical specifications
Analogue bandwidth DC to 100 kHz
Frequency accuracy 0.1 % of reading
Basic accuracy 0.05 % of reading
Sampling frequency 500 kHz
Input impedance 2 MΩ
Current measurement range 1 mA to 20 A
Voltage measurement range 1 mV to 600 V
Power measurement range Depends on a combination of voltage and current ranges 50 µW to 12 kW
Display and interfaces
Display resolution 5 digits, 10 updates/s
Remote control interfaces: standard All models USB-TMC, USB-CDC (virtual COM), LAN
Remote control interfaces: optional R&S®NPA501-G, R&S®NPA701-G IEEE-488 (GPIB)
Display 320 × 240 pixel (QVGA-colour)
Special functions
Basic All models active power, apparent power, reactive power, lambda power factor, phase shift, frequency, voltage (RMS and average), current (RMS and average), total harmonic distortion, energy, data logging
Graphical R&S®NPA501(-G), R&S®NPA701(-G) trend chart mode, inrush mode, harmonics mode, waveform mode
Advanced R&S®NPA501(-G), R&S®NPA701(-G) limit testing, input for external probe and shunt, analogue input and output, digital input and output, minimum & maximum voltage, current and power
Compliance evaluation R&S®NPA701(-G) Standards: IEC62301, EN 50564, EN 61000-3-2
General data
Rated mains voltage and frequency range AC 100 V to 115 V/230 V at 50 Hz to 60 Hz
Rated power 35 W (meas.)
Operating temperature range +5 °C to +40 °C
Dimensions 222 mm × 97 mm × 291 mm
(8.74 in × 3.82 in × 11.5 in)
Weight approx. 3.25 kg (7.16 lb)

Comparison of Functional Ranges within NPA Series:

Function Description R&S®NPA101 R&S®NPA501 R&S®NPA701
P Active power (W)
S Apparent power (VA)
Q Reactive power (VAR)
PF Lambda power factor (λ)
PHI Phase shift (φ)
FU Voltage frequency value (Hz)
FI Current frequency value (Hz)
FPLL Acquisition frequency (Hz)
URMS RMS voltage (U RMS)
UAVG Average voltage (U AVG)
IRMS RMS current (I RMS)
IAVG Average current (I AVG)
UTHD Total harmonic distortion U
ITHD Total harmonic distortion I
WHM, WHP, WH, AHM, AHP, AH Energy counter (integrator values)
Logging Measured value logging (CSV)
UPPeak Maximum voltage (U PEAK)
UMPeak Minimum voltage (U PEAK)
IPPeak Maximum current (I PEAK)
IMPeak Minimum current (I PEAK)
PPPeak Maximum power (P PEAK)
PMPeak Minimum power (P PEAK)
Harmonics Bargraph of up to 50 harmonics
Waveform Waveform display (displays one period of voltage, current or power)
Trend chart Current and voltage are displayed as a waveform
Inrush Triggered display of waveform (single shot)
Limit / PASS/FAIL Limit display
Sensor input Input for current probe/external shunt
DIN/AIN Digital/analogue inputs and outputs (BNC)
IEC 62301 Standby standard
EN 50564 Extended standby
EN 61000-3-2 Harmonic current for EMC, CE approval


You may also like…

Mandatory Accessories …

  • Image of Power cord

    UK Power Cord

    .
    Read more

Optional Accessories …