


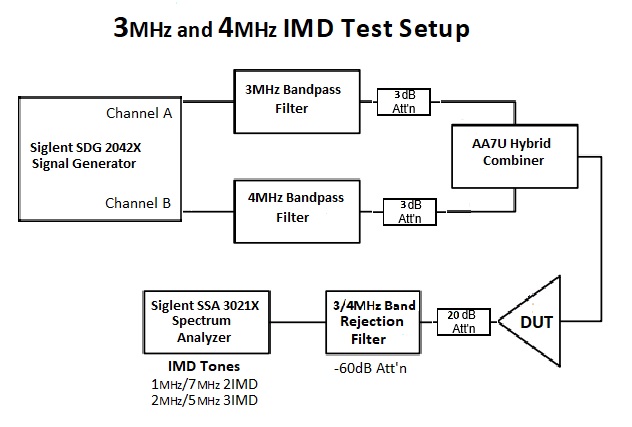
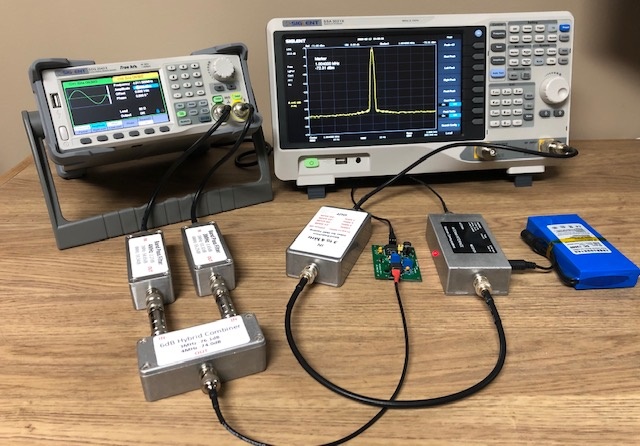
Two SIGLENT SDG owners and Amateur Radio operators and frequent experimenters, Steve Ratzlaff AA7U and Everett Sharp N4CY, got together and built a very thorough test procedure for testing Intermodulation Distortion (IMD) on a Loop Amplifier using a SIGLENT SDG2042X generator and SSA3021X spectrum analyser.
IMD is an important test for verification of audio amplifiers and radio receivers as high IMD can cause audible distortion that can decrease the quality of the transmission.
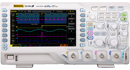
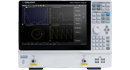
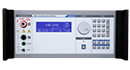
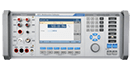
In this experiment, AA7U and N4CY use a SIGLENT SDG2042X generator to deliver the IMD tones and a SIGLENT SSA3X spectrum analyser to measure the result.
They also build some filtering to help decrease the harmonic content of the generator and build a coupler with better performance than commercially available products.
***
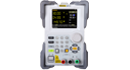
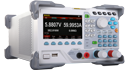
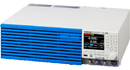
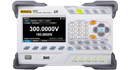
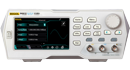
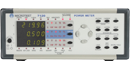
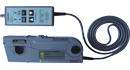
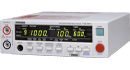
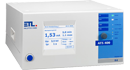
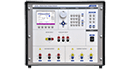
Siglent SDG2042X (AWG) Dual Channel Arbitrary Waveform Generator set up for use in IMD Test Set
- Turn on the AWG (arbitrary waveform generator) — wait for it to initialise.
- Frequency is highlighted, with 1 kHz the default. Enter “3”, then touch “MHz” at the bottom left. (By touching the screen where it says Frequency, you can enter the frequency on the keypad “3” then at the bottom of the screen touch “MHz” and that will set the frequency).
- You will need to be set to 3 MHz (3.007 MHz) on Channel 1 and set 4 MHz (4.011 MHz) on channel 2 (Note: The reason for using the odd frequencies is the Siglent SSA3021X (SA.. or Spectrum Analyzer) has a sub-harmonic spur at 5 MHz)
- Load–HI Z is the default. Select “50 Ω” at the bottom, by touching the screen.
- Amplitude–2.00 Vpp is the default when in 50 ohms load. Enter “0”, then touch “dBm” on the bottom (fifth one over from the left–Vpp; mVpp; Vrms; mVrms; dBm). Make sure to set dBm.
- Output–OFF is the default. Touch it and it turns ON and the Ch1 indicator turns on with the button also, by its BNC connector.
- Repeat the above for Ch 2 as described above.
- Adjust Amplitude settings for each channel, which are going through the Band Pass Filter (BPF), 3 dB attenuator, combiner and DUT under test for a 0 dBm on the SA, with the SA internal Attenuator set at -20 dB.
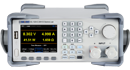
(Note: As an example, this will be around (~ -10dBm). Make sure that the 3 MHz BPF is connected to the 3.004 MHz Channel and the 4 MHz BPF is connected to the 4.011 MHz Channel. 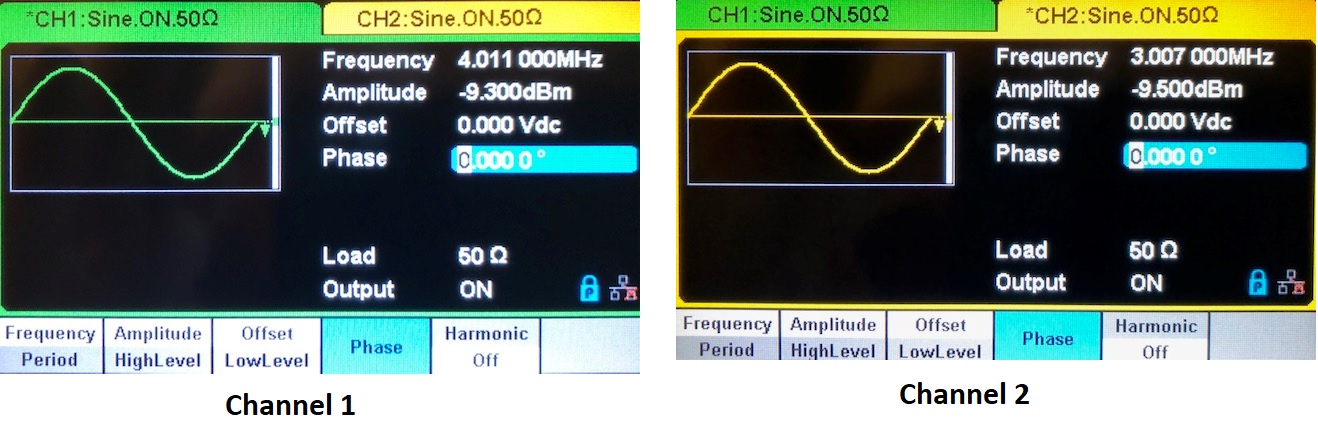 IMD Test Setup–Spectrum Analyzer setup for Siglent SSA 3021X
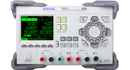
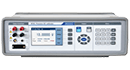
There are two parts to the setup–the first part sets the levels at the DUT output to 0 dBm; the second part measures the IMD.
Part 1
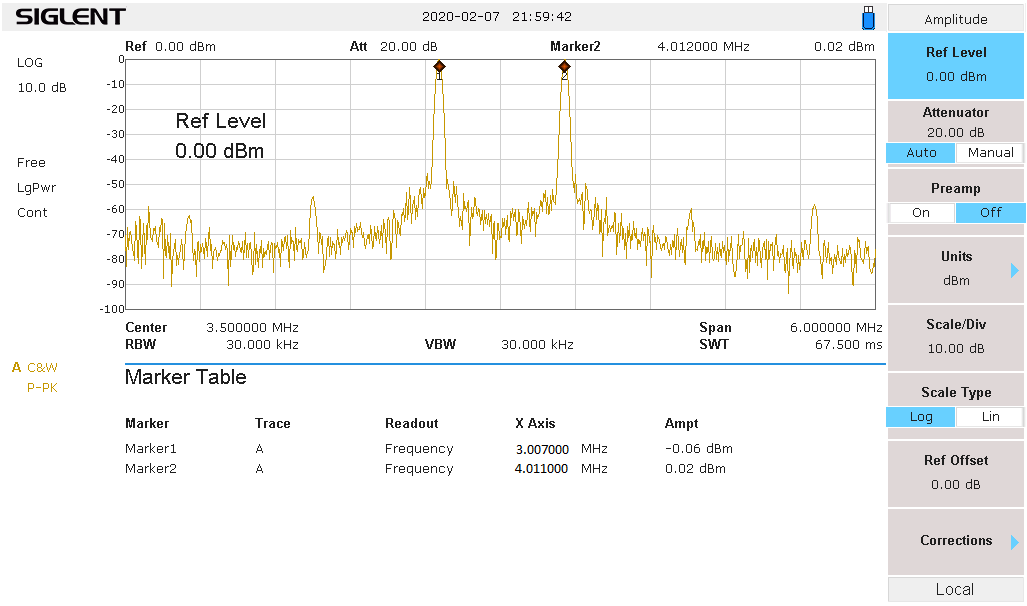
(Calibration) Push “Preset”, Top Right, to set up for initial setup.
Set Center Freq 3.5 MHz, Span 6 MHz, Amplitude Ref Level +10 dBm
- Connect the DUT (Power On) output to SA input. Tune to one, either the 3 MHz, or 4 MHz test tones on the AWG. Adjust the generator (AWG) for 0 dBm on the SA, within 0.1 dB. Tune to the other test tone, adjust the generator for 0 dBm.
SA: Recheck each tone again to make sure nothing has changed. This concludes the initial setup.
Part 2
- Disconnect the DUT output from SA and connect it to the Reject Filter input (Which has the 20 dB built-in Attenuator). Connect the Reject Filter output to SA RF input.
2. Now look at the 4 IMD frequencies.
-
- Span set to 1 kHz
- Amplitude turn Preamp Off; set Ref Level to -60 dBm, Set Attenuation to Manual and set Attenuation to 0.00 dB.
- Push the Trace button and look for and select “Avg Times 100”, which is located on the right bottom side of the screen.
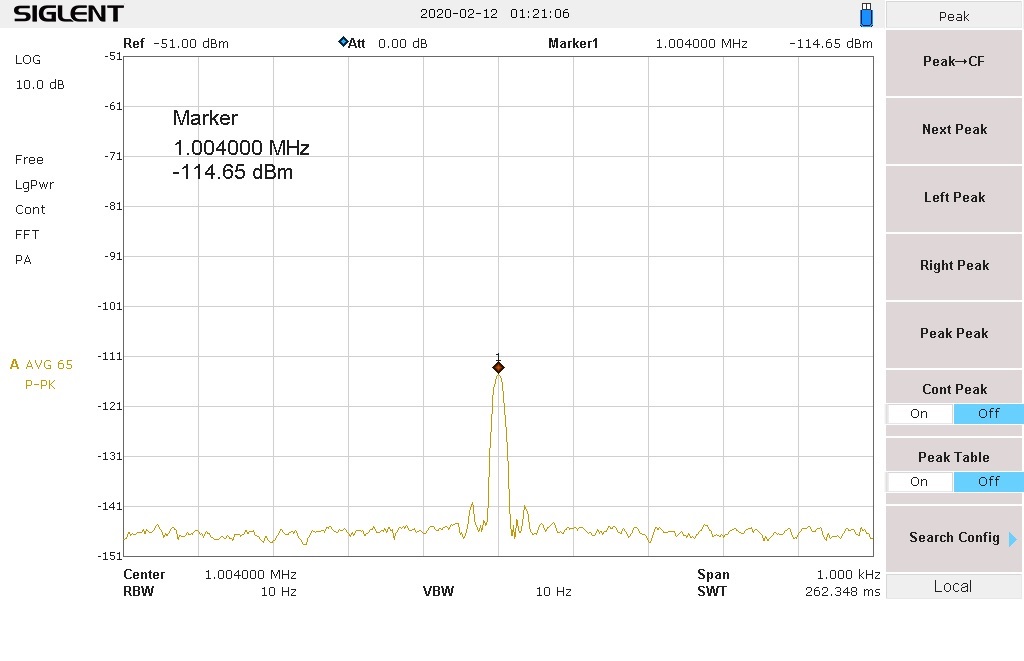
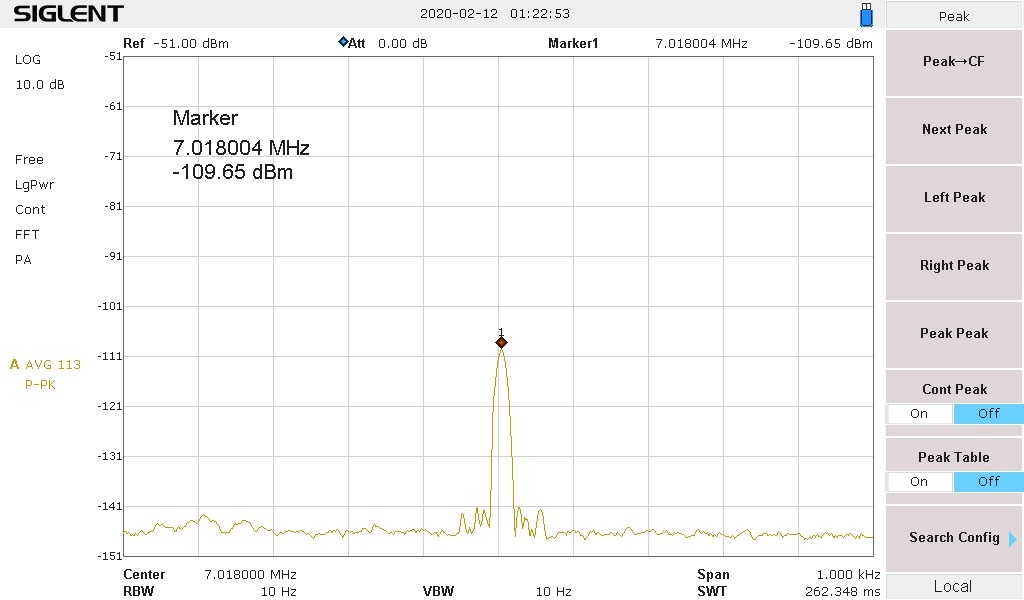
The 4 frequencies you will be looking at are: Center Freq 1 MHz (1.004 MHz), 7 MHz (7.018 MHz), 2 MHz (2.003 MHz) and 5 MHz (5.015 MHz),
- You should now be seeing the 2IMD product in the center of the display 1 MHz (1.004 MHz). Push the Peak button or push Marker button and use the main tuning knob to tune to the peak of the signal. It will probably vary up and down, but wait for 100 averages and decide what the middle value is and write that down.
- Tune to the 7 MHz (7.018 MHz) 2IMD product and note its level–write that down.
- Tune to 2 MHz (2.003 MHz) 3IMD product, this will normally be much weaker, where the SA’s preamp may be needed to see it. Write down that level.

- Tune to 5 MHz (5.015 MHz), write down that level. You now have measured the four IMD levels.

Use the formula for determining OIP2. (2IMD level – Reject Filter loss at that frequency 1 and 7 MHz) = OIP2.
Determine the OIP2 for both 2IMD frequencies. They are usually different–use the worst case, or specify both Output Intercepts.
Use the formula for OIP3. (3IMD level – Reject Filter loss at that frequency 2 MHz and 5 MHz) /2 = OIP3. Determine OIP3 for both 3IMD frequencies. Usually, they are about the same.
Examples
My reject filter has a -21.6 dB loss at 1 MHz; -20.39 dB loss at 7 MHz for the 2IMD frequencies. There is a -20.65 dB loss at 2 MHz and -22.62 dB loss at 5 MHz for the 3IMD frequencies.
The examples used in the below calculations were taken from the above IMD sweeps.
1 MHz (-109.65 dBm) – (-21.6 dB loss) = (109.65 – 21.6 = 88.5) = +88.05 dB OIP2.
7 MHz (-111.66 dBm) – (-20.39 dB loss) = (111.66 – 20.39 = 91.27) = +91.29 dB OIP2.
Normally you take the worst case and state that, which would be +88.05 dB
2 MHz (~-112.9 dBm) – (-20.65dB loss) = (112.9 – 20.65) = 92.25/2 = +46.13 dB OIP3.
5 MHz (~-111.66 dBm) – (-22.62 dB loss) = (111.66 – 22.62) = 89.04/2 = +44.52 dB OIP3.
Normally these should be very close, otherwise take the worst case, which would be +44.62 +dB
and state that.
System IMD Intercept Test with Band Pass Filters, Combiner and 3 MHz and 4 MHZ Band Rejection Filter connected to the SA
They are all at the noise floor, which is very good. It took adding Band Pass Filters in place of Low Pass Filters to achieve the results Below.
1 MHz (1.004 MHz) -151.26 dBm
7 MHz (7.018 MHz -152.45 dBm
2 MHz (2.003 MHz) -153.51 dBm
5 MHz (5.015 MHz) -152.26 dBm
These are the simple formulas for second and third order IMD, you can take any two frequencies and work out the IMD products
Second order: F1 + F2; F2 – F1
Third Order: 2F1 + F2; 2F1 – F2; 2F2 + F1; 2F2 – F1
3 MHz and 4 MHz tones: 3 + 4 = 7 MHz ; 4 – 3 = 1 MHz; 6 + 4 = 10 MHz; 6 – 4 = 2 MHz; 8 + 3 = 11 MHz; 8 – 3 = 5 MHz
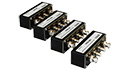
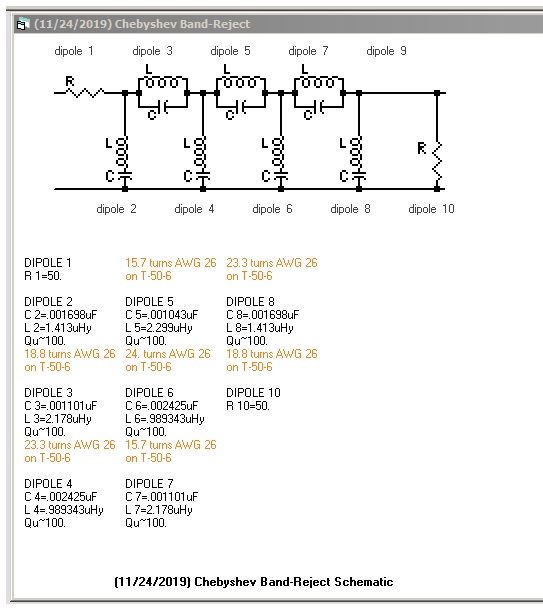
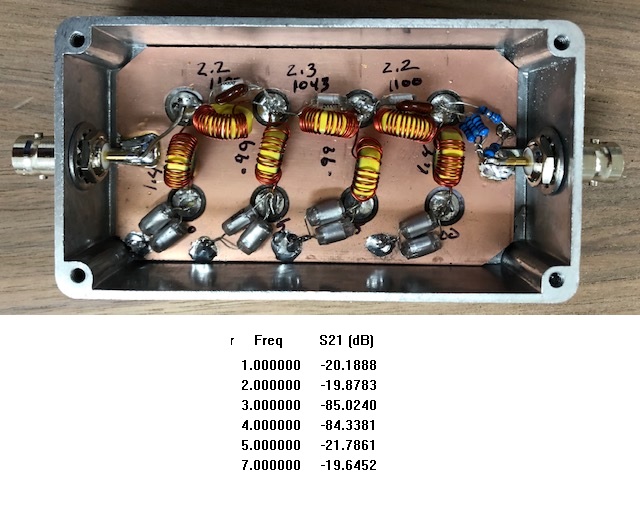
Building the Bandstop Rejection Filters
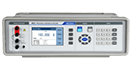
The easiest way to build and tune this filter is to test each Dipole (Tuned Circuit) by its self. It should be 3,250 kHz. Below is a sweep from my VNA, as this is what I used to check and tune each Dipole. I was able to tune the parallel circuits by having one side soldered to its pad and then connect the other end after tuning. You can also use the SIGLENT SSA3000X, SSA3000X Plus, or SVA to tune the filter.. as shown in this note on Filter Testing Using a SIGLENT Spectrum Analyser
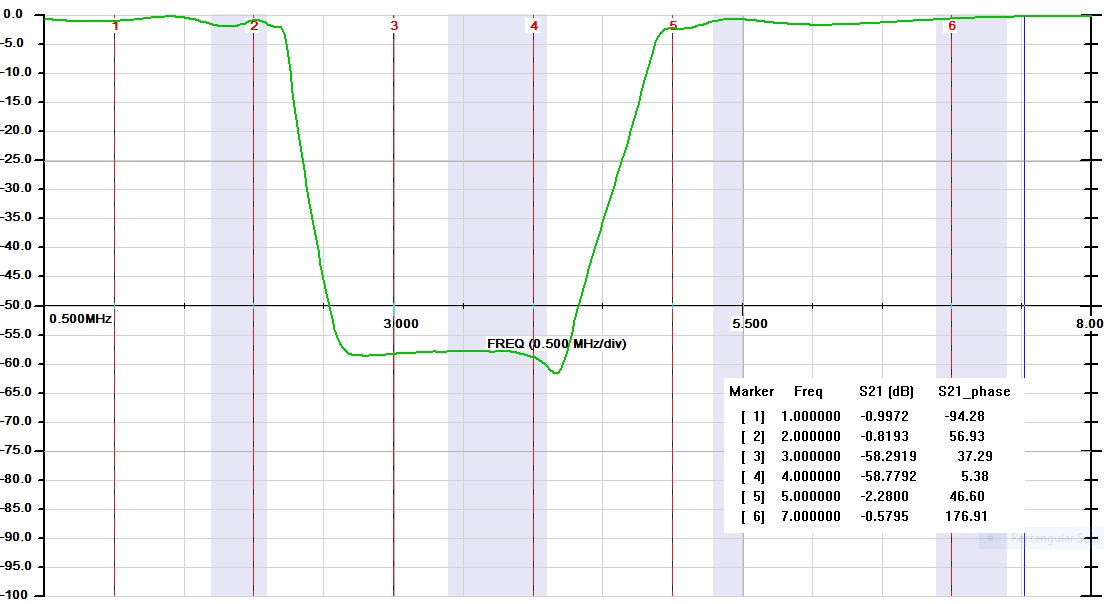
Below is a sweep of the final Band Rejection filter that is being used for IMD testing. There is around 58 dB rejection for 3 and 4 MHZ
Below is the finished 3/4 MHz Bandstop Filter and Sweep
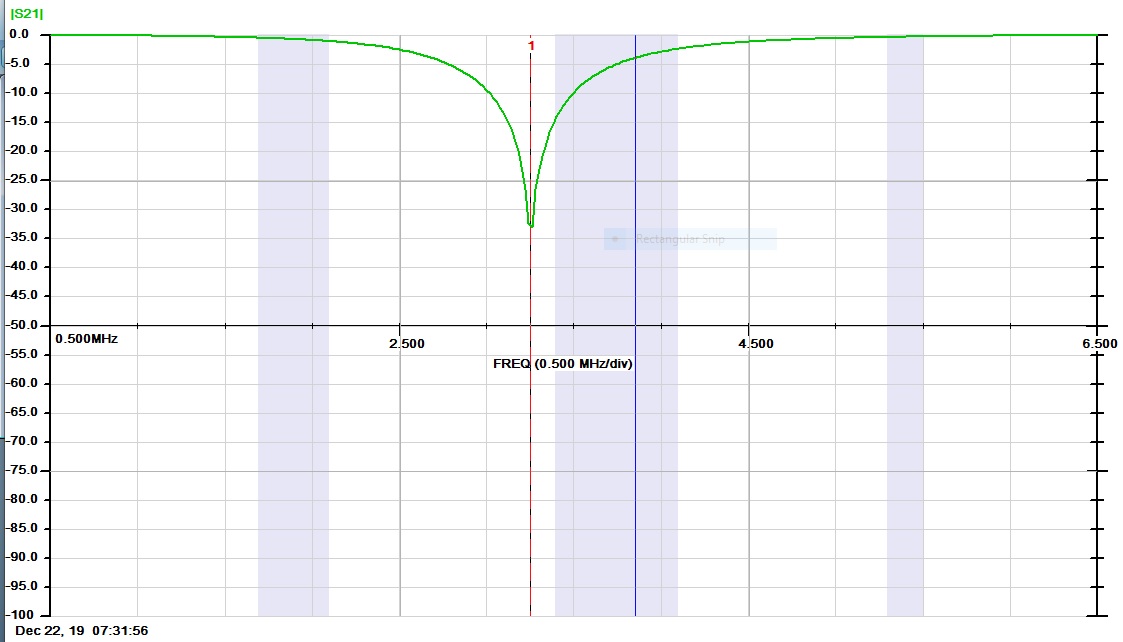
Below is a sweep of the final Band Rejection filter that is being used for IMD testing. There is around 58 dB rejection for 3 and 4 MHZ
A 20 dB pi pad can be done with 62 ohms shunts and a 270 ohm in parallel with 3300 ohms for the series resistor. (249.6 shown on the diagram. The theoretical value is 248 ohms.)
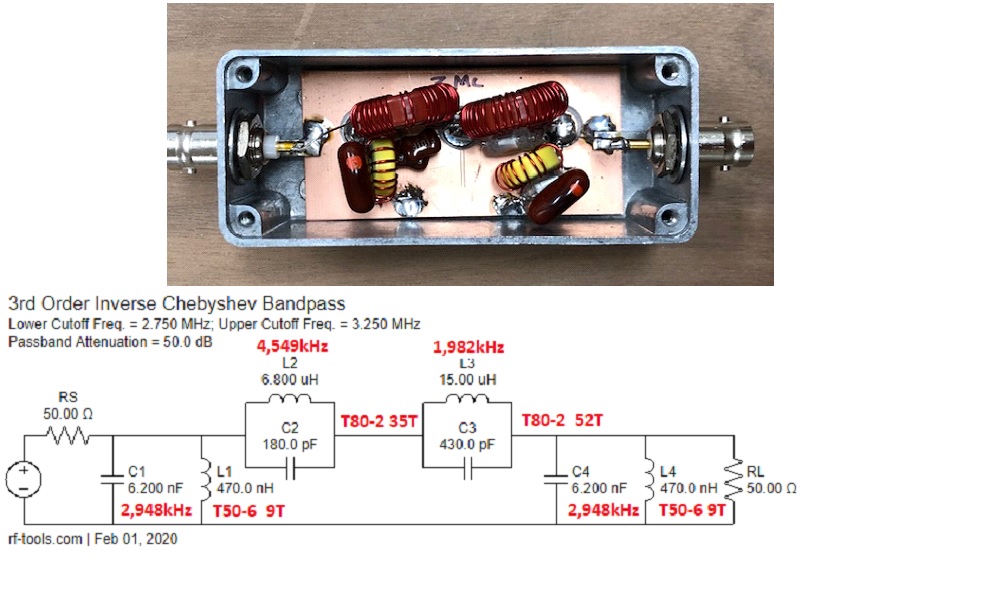
Both the 3 MHz and 4 MHz Bandpass filters are easy to build if you will tune each pole and install it as you go. I have marked the frequencies in Red for each pole. Also, I have indicated which Micrometal Toroids that were used with the turns required for each pole. You may have to make some adjustments to each of the poles, as there are variations from lot to lot with the toroid core. I also found it helpful to use an LCR meter to make adjustments in the turns count to get the desired inductance. I used an Array Solutions VNA2180 to tune each pole and evaluate the final filter. A SIGLENT SVA1000X VNA can also be used.
4 MHz BPF
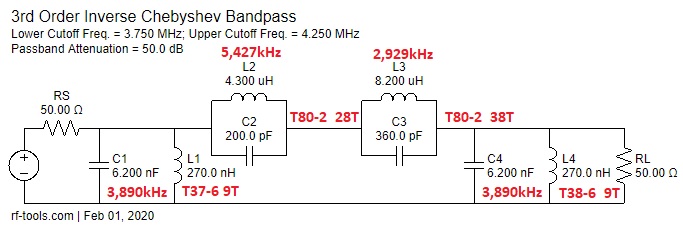
3 MHz BPF
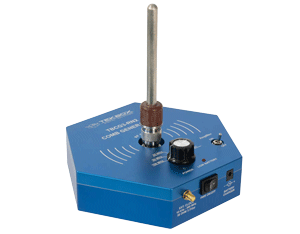
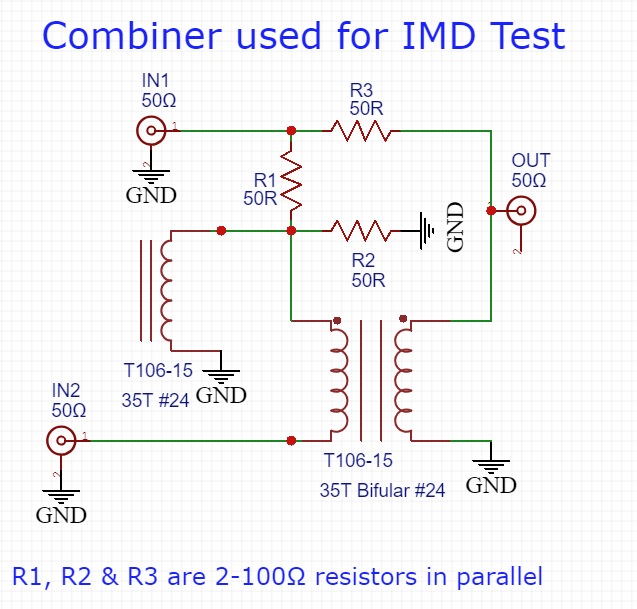
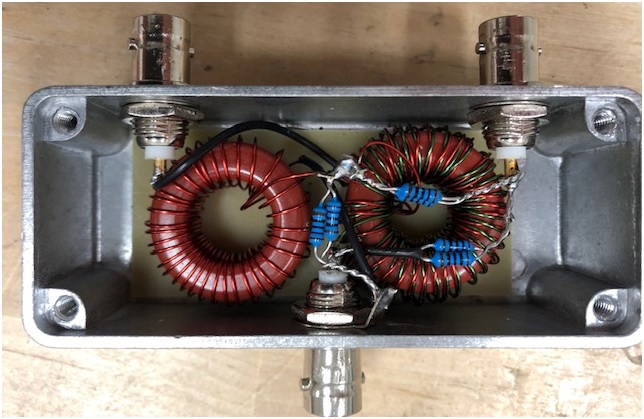
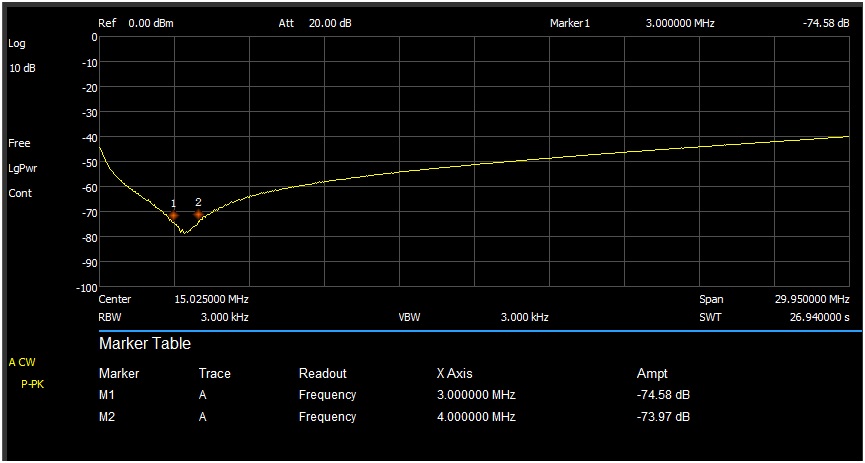
AA7U Hybrid Combiner
The loss through the filter is 6.13 dB/5.95 dB and the isolation between the two input ports is 74.58 dB at 3 MHz and 73.97 dB at 4 MHz (Measured with a 50Ω Termination at the output port.) After completing and testing the filter I filled it up with hot melt glue.
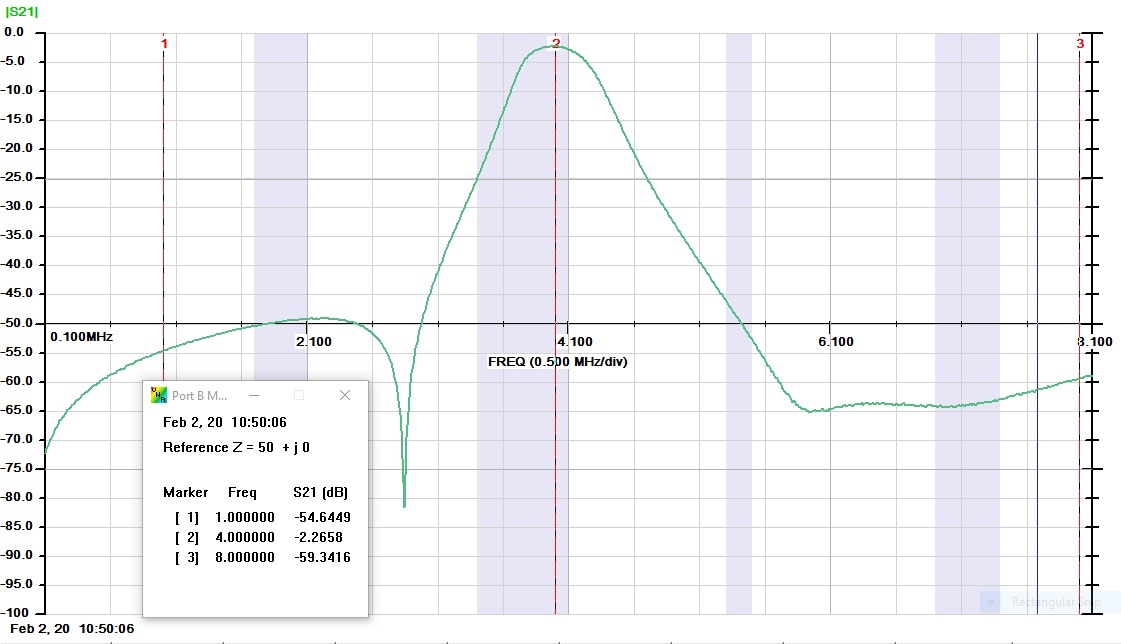
Below is a sweep of the Hybrid Combiner between the two input ports and it was terminated with 50Ω at the output port.
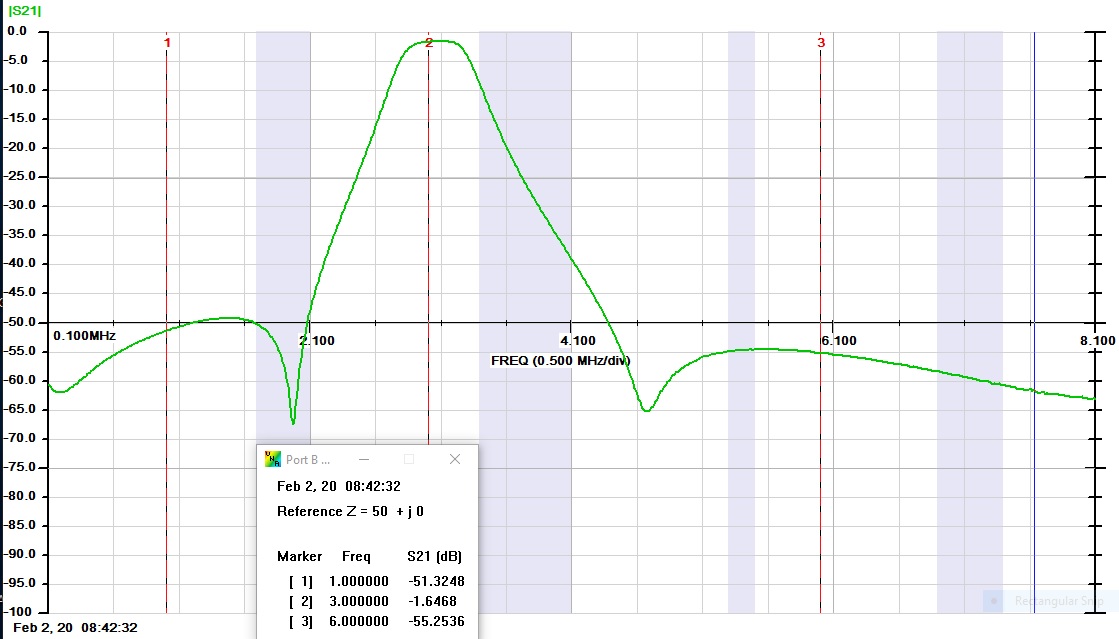
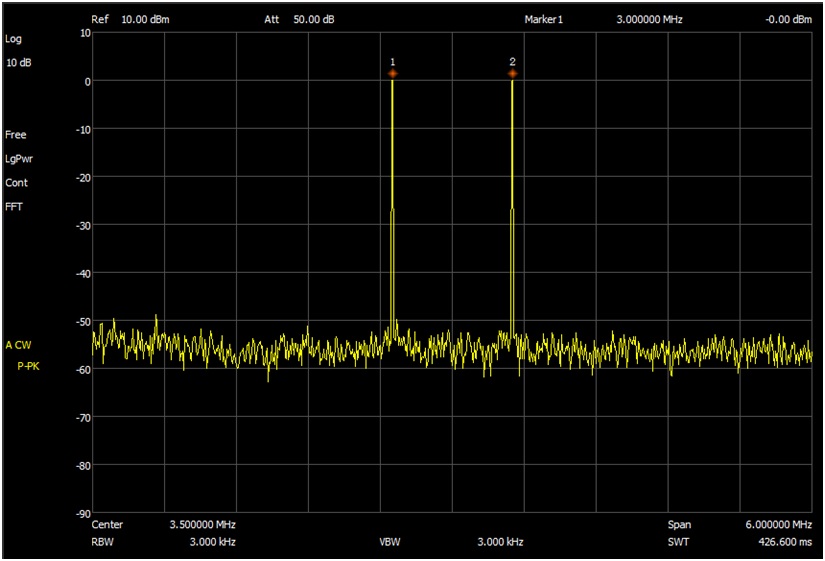
This is a sweep showing the two test tones 3 MHz and 4 MHz using the Hybrid Combiner. Notice how sharp they are.
How to take screenshots of the Siglent SA
Insert the thumb drive into the front USB port of Siglent.
You should see a blue USB icon in the upper right-hand corner of the screen.
Hit the File button
You should see a file directory similar to what you would see on a PC.
Under the Folder column, you should see two directories:
Local: free 80.74 MB (your size may be different)
+U-disk0: 748.00 KB/975.88 ME (your size may be different)
On the right-hand side soft keys, the “Save Type” should be PNG.
Hit the button and select JPG (or whatever file type you want – CSV, LIM, JPG, BMP, etc.)
Rotate your frequency tune knob and select your +U-disk0 directory
You should see the files currently on your thumb drive
Hit the Enter button
Hit the Operate button
Hit the Marker button
You should now be back at your main display screen
Setup a screen that you want to save
Hit the Save button
A pop-up window will show you a default file name of Name: JPG1 and an Input type: abc
I like to use a numeric file name, so I hit the +/- button
Now I backspace out the default “JPG1” file name
I enter the numeric name that I want to use. Example: 111
I find it quicker to use quick numeric file names and rename the file once the thumb drive is attached to my PC
Hit the Enter button
You may or may not see a brief text message on the screen about the screen being saved to your thumb drive.
To confirm that the file was saved to your thumb drive, Hit the File button
Use the Frequency control knob and select your thumb drive directory
In the directory listing for the thumb drive, you should see your recently saved screen snapshot
For some reason, the screen sometimes saves to the internal Siglent memory. When this happens, I go through the steps again about setting up a save to the thumb drive. I suspect that my steps are a little flakey in this area.
Once the Flash drive is set up you can save the screenshots by pressing the Save button, which will number the shot and then press the Enter button.
Products Mentioned In This Article:
- SDG2000X Series please see HERE
- SSA3000X Series please see HERE
- SSA3000X Plus Series please see HERE
- SVA1000X Series please see HERE
Tags: Siglent Function Generators